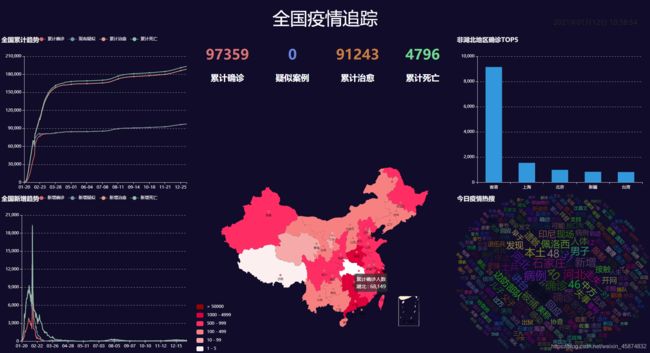
使用python对疫情数据进行可视化分析
文章目录
-
- 1.获取并处理疫情数据
-
- 1.1疫情数据的获取
- 1.2疫情数据的分析及处理
- 1.3使用selenium爬取百度热搜榜
- 2.存储数据到mysql
-
- 2.1设计数据库表
- 2.2保存数据到mysql中
- 3 .实现数据可视化
-
- 3.1flask项目的创建
- 3.2关键字与时间的显示
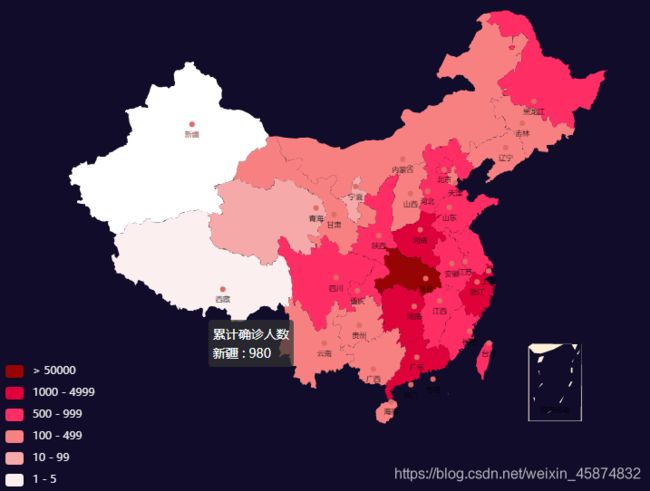
- 3.3全国疫情地图的实现
-
- 3.3.1使用echart实现中国地图可视化
- 3.3.2疫情地图数据的显示
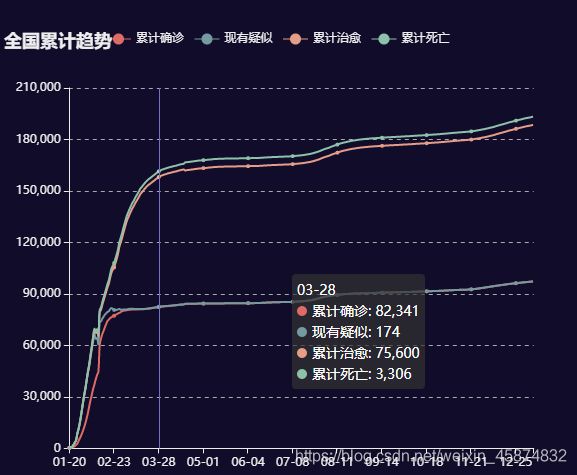
- 3.4全国疫情累计趋势折线图显示
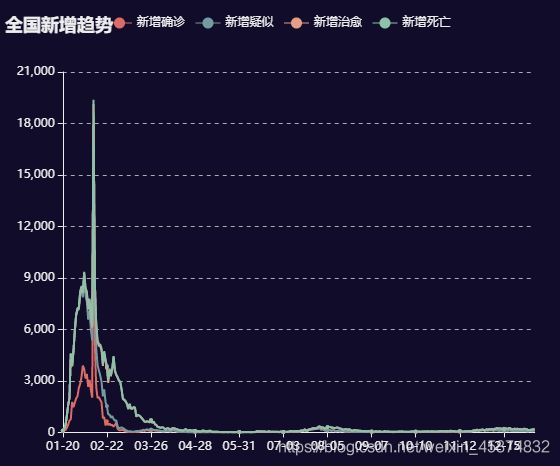
- 3.4全国疫情新增趋势折线图显示
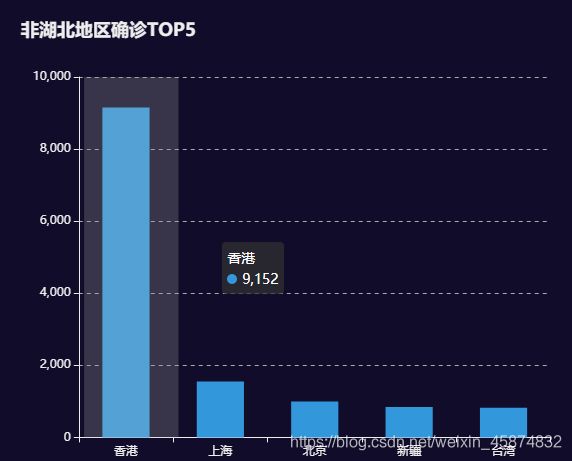
- 3.5非湖北地区确诊Top5柱状图显示
- 3.6百度热搜词云图显示
- 4.使用爬虫脚本对疫情数据进行实时更新
- 5.最终界面显示
- 结语
1.获取并处理疫情数据
1.1疫情数据的获取
获取数据之前应事先分析数据所在的url,进入腾讯疫情实时追踪网站以后,打开抓包工具可以看到图下两个url,实际上全国疫情数据是以json的形式保存在这两个url中,要获取疫情数据数据可以直接访问以下两个url将它们保存以json的文件格式到本地,或者通过python的request请求得到,也可以使用同样的方式获取全球的疫情数据,本文只对全国疫情数据进行了可视化展示。
本文所用到的数据来源于腾讯疫情实时追踪
当日详情数据:详情数据
历史数据:历史数据

1.2疫情数据的分析及处理
拿到疫情数据之后,需要对数据进行分析以及相应的处理才能保存到数据库中。博主通过使用json格式化工具分析了历史数据json字符串和当日详情数据json字符串中的key为data的值,json字符串也是类似于Python中的字典,如下图,本文主要对图上的数据进行了存储以及分析,其他数据没有分析及处理。
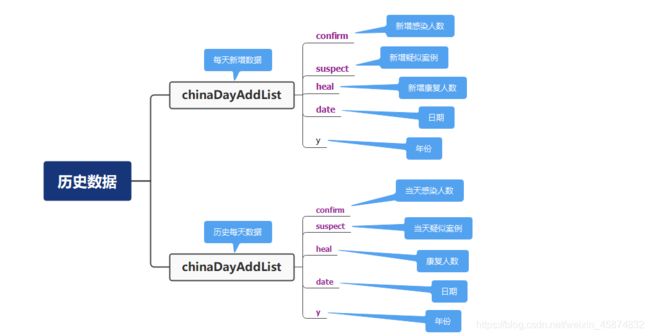
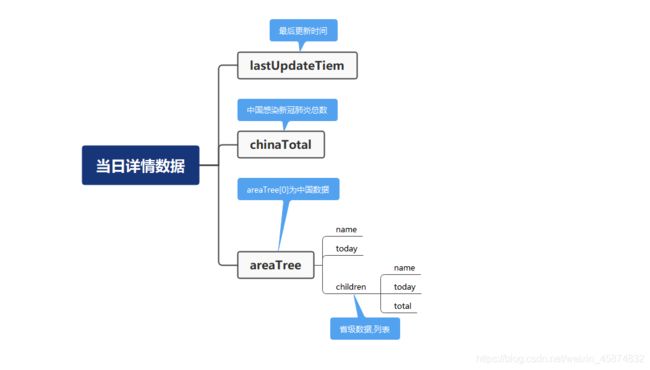
通过分析数据之后,需要将json字符串转化成字典,并将字典中的数据保存到列表或字典中,由于获取的详情数据json字符串中的data也是一个json字符串,所以要将data中的值也要转化成字典,这样就可保存我们所需要的的数据了。在保存数据时,需要将时间的格式转化一下,不然插入数据到数据库会出错。
def get_cov_data():
    #详情数据url
    details_url=' https://view.inews.qq.com/g2/getOnsInfo?name=disease_h5'
    #历史数据url
    history_url='https://api.inews.qq.com/newsqa/v1/query/inner/publish/modules/list?modules=chinaDayList,chinaDayAddList,nowConfirmStatis,provinceCompare'
    headers='Mozilla/5.0 (Windows NT 10.0; Win64; x64) AppleWebKit/537.36 (KHTML, like Gecko) Chrome/89.0.4350.7 Safari/537.36'
    details_response=requests.get(details_url,headers)
    #将获取的详情数据json字符串转化成字典
    details_json=json.loads(details_response.text)
    #key为data的json字符串转化成字典
    details_dic=json.loads(details_json['data'])
    history_response=requests.get(history_url,headers)
    #将历史数据json字符串转化成字典
    history_dic=json.loads(history_response.text)['data']
    history={}
    details = []
    #将历史数据保存
    for i in history_dic['chinaDayList']:
        date=i['y']+'.'+i['date']
        tup=time.strptime(date,'%Y.%m.%d')
        #改变时间格式不然插入数据时数据库会报错
        date=time.strftime('%Y-%m-%d',tup)
        confirm=i['confirm']
        suspect=i['suspect']
        dead=i['dead']
        heal=i['heal']
        history[date]={"confirm":confirm,"suspect":suspect,"heal":heal,"dead":dead}
    #将历史当天新增数据保存
    for i in history_dic['chinaDayAddList']:
        date=i['y']+'.'+i['date']
        tup=time.strptime(date,'%Y.%m.%d')
        date=time.strftime('%Y-%m-%d',tup)
        confirm=i['confirm']
        suspect=i['suspect']
        dead=i['dead']
        heal=i['heal']
        history[date].update({"confirm_add":confirm,"suspect_add":suspect,"heal_add":heal,"dead_add":dead})

    update_time=details_dic['lastUpdateTime']
    data_countries=details_dic['areaTree']
    #获取省级数据列表
    data_provinces=data_countries[0]['children']
    #将详情数据保存
    for pro_info in data_provinces:
        provinces_name=pro_info['name']
        for city_info in pro_info['children']:
            city_name=city_info['name']
            confirm=city_info['total']['confirm']
            confirm_add=city_info['today']['confirm']
            heal=city_info['total']['heal']
            dead=city_info['total']['dead']
            details.append([update_time,provinces_name,city_name,confirm,confirm_add,heal,dead])
    return history,details
1.3使用selenium爬取百度热搜榜
爬取百度热搜榜的数据可以直接使用request模块的request请求,也可以使用selenium自动化爬取。楼主这里使用的是selenium模块自动爬取热搜榜,在使用之前需要下载对应版本的浏览器驱动,以谷歌87.0为例,需要下载87.0版本的谷歌驱动,还需pip安装selenium模块。爬取的思路为,实例谷歌浏览器对象,get请求百度热搜榜网址,使用xpath定位到每一个热搜标题和热搜热度所在的标签,并获取它们的文本内容,以字典的格式封装,便于将数据保存到数据库中。
def get_search():
    #设置无头浏览器
    options = webdriver.ChromeOptions()
    options.add_argument('--headless')
    options.add_argument('--disable-gpu')
    #实例谷歌浏览器对象
    browser = webdriver.Chrome(executable_path=r'C:\Users\a南\PycharmProjects\pythonProject\reptile\code\chromedriver.exe',options=options)
    url="http://top.baidu.com/buzz/shijian.html"
    #get请求百度热搜榜url
    browser.get(url)
    tr=browser.find_elements_by_tag_name("tr")
    context=[]
    #获取每个热搜的标题以及对应的热度,并封装在字典中
    for i in range(2,len(tr)+1):
        title=browser.find_element_by_xpath('//table[@class="list-table"]/tbody/tr['+str(i)+']//td[@class="keyword"]').text
        heat=browser.find_element_by_xpath('//table[@class="list-table"]/tbody/tr['+str(i)+']//td[@class="last"]').text
        context.append({"title":title,"heat":heat})
    return context
    browser.close()
2.存储数据到mysql
2.1设计数据库表
在存储数据之前,先要对数据表进行相应的设计。根据获取的数据本文设计了保存详情数据的details表,保存历史数据的history表,保存百度热搜的hotsearch表
--details表
DROP TABLE IF EXISTS `details`;
CREATE TABLE `details`  (
  `id` int(0) NOT NULL AUTO_INCREMENT,
  `update_time` datetime(0) NULL DEFAULT NULL,
  `province_name` varchar(50) CHARACTER SET utf8 COLLATE utf8_general_ci NULL DEFAULT NULL,
  `city_name` varchar(50) CHARACTER SET utf8 COLLATE utf8_general_ci NULL DEFAULT NULL,
  `confirm` int(0) NULL DEFAULT NULL,
  `confirm_add` int(0) NULL DEFAULT NULL,
  `heal` int(0) NULL DEFAULT NULL,
  `dead` int(0) NULL DEFAULT NULL,
  PRIMARY KEY (`id`) USING BTREE,
  INDEX `id`(`id`) USING BTREE
) ENGINE = InnoDB AUTO_INCREMENT = 463 CHARACTER SET = utf8 COLLATE = utf8_general_ci ROW_FORMAT = Dynamic;

SET FOREIGN_KEY_CHECKS = 1;

--history表
DROP TABLE IF EXISTS `history`;
CREATE TABLE `history`  (
  `ds` datetime(0) NOT NULL,
  `confirm` int(0) NULL DEFAULT NULL,
  `confirm_add` int(0) NULL DEFAULT NULL,
  `suspect` int(0) NULL DEFAULT NULL,
  `suspect_add` int(0) NULL DEFAULT NULL,
  `heal` int(0) NULL DEFAULT NULL,
  `heal_add` int(0) NULL DEFAULT NULL,
  `dead` int(0) NULL DEFAULT NULL,
  `dead_add` int(0) NULL DEFAULT NULL,
  PRIMARY KEY (`ds`) USING BTREE,
  INDEX `ds`(`ds`) USING BTREE
) ENGINE = InnoDB CHARACTER SET = utf8 COLLATE = utf8_general_ci ROW_FORMAT = Dynamic;

SET FOREIGN_KEY_CHECKS = 1;

--hotsearch表
 DROP TABLE IF EXISTS `hotsearch`;
CREATE TABLE `hotsearch`  (
  `id` int(0) NOT NULL AUTO_INCREMENT,
  `ds` datetime(0) NULL DEFAULT NULL,
  `context` varchar(255) CHARACTER SET utf8 COLLATE utf8_general_ci NULL DEFAULT NULL,
  `heat` int(0) NULL DEFAULT NULL,
  PRIMARY KEY (`id`) USING BTREE,
  INDEX `id`(`id`) USING BTREE
) ENGINE = InnoDB CHARACTER SET = utf8 COLLATE = utf8_general_ci ROW_FORMAT = Dynamic;

SET FOREIGN_KEY_CHECKS = 1;
2.2保存数据到mysql中
使用pymysql模块将数据保存到mysql数据库中,大致步骤是获取数据库连接,执行sql语句,提交事务,关闭连接,在获取数据库连接时需要将参数改成自己的数据库参数
1.疫情详情数据与疫情历史数据的持久化存储
#获取连接
def get_connect():
    con = pymysql.connect(host="localhost", port=3306, user="root", passwd="root", db="newsqa", charset="utf8")
    cur = con.cursor()
    return con,cur

#关闭连接
def close_connect(con,cur):
    if con:
        con.close()
    if cur:
        cur.close()

#保存详情数据到数据库中
def save_details():
    con=None
    cur=None
    try:
        li=get_data()[1]
        con,cur=get_connect()
        sql="insert into details(update_time,province_name,city_name,confirm,confirm_add,heal,dead) values(%s,%s,%s,%s,%s,%s,%s)"
        for item in li:
            cur.execute(sql,item)
        con.commit()
        print('详情数据保存成功')
    except:
        traceback.print_exc()
    finally:
        close_connect(con,cur)

#保存历史数据到数据库中
def save_history():
    con=None
    cur=None
    try:
        li=get_data()[0].items()
        con,cur=get_connect()
        sql="insert into history(ds,confirm,confirm_add,suspect,suspect_add,heal,heal_add,dead,dead_add) values(%s,%s,%s,%s,%s,%s,%s,%s,%s)"
        for k,v in li:
            cur.execute(sql,[k,v.get('confirm'),v.get('confirm_add'),v.get('suspect'),v.get('suspect_add'),v.get('heal'),v.get('heal_add'),v.get('dead'),v.get('dead_add')])
        con.commit()
        print('历史数据保存成功')
    except:
        traceback.print_exc()
    finally:
        close_connect(con,cur)
2.百度热搜数据的持久化存储
def save_search():
    con,cur=None,None
    try:
    	context=get_search()
        con,cur=get_connect()
        sql="insert into hotsearch(ds,context,heat) values(%s,%s,%s)"
        for i in context:
            cur.execute(sql,(time.strftime("%Y-%m-%d %X"),i.get('title'),i.get('heat')))
            con.commit()
            print("数据保存成功")
    except:
        traceback.print_exc()
    finally:
        close_connect(con,cur)
3 .实现数据可视化
3.1flask项目的创建
1.若使用的IDE的是pycharm,可选择pycharm右上角的File,点击新建项目,选择Flask,点击创建,项目环境建议使用虚拟环境,使用虚拟环境可以使各个项目互相隔离,各不影响。
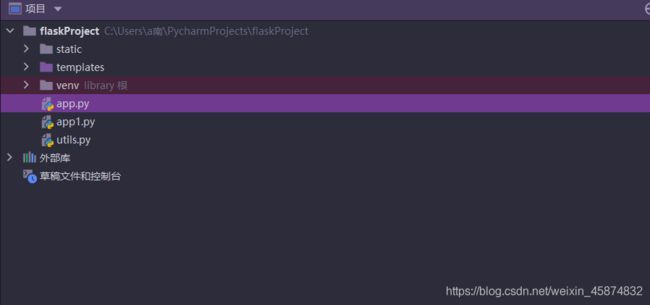
2.创建好flask项目可以看到如下界面。flask项目的大致结构为,static目录存放静态资源,例如css,js等,templates存放页面资源,例如HTML,venv是该项目的虚拟环境,py文件实现后端的业务功能
3.2关键字与时间的显示
本项目将数据库中的数据在前端页面中显示,采用的是web项目中的一个三层结构,及展示层,业务层,数据访问层,展示层使用ajax技术实现前端和后端之间的交互,业务层使用flask框架实现业务逻辑的处理,数据访问层使用utils工具类获取数据库中的数据。
1.展示层
将ajax请求同一放在controller.js文件中,使用的时候引入即可。get_tiem函数请求后端路由的/time,每一秒请求一次,请求成功后将将响应给客户端的当前时间信息显示在页面上,get_c1_data函数请求后端路由中的/center1,请求成功后将将关键字数据显示在页面中。
function get_time() {
    $.ajax({
        //请求的url地址
            url: "/time",
        //隔一秒执行该js时间
            timeout: 1000,
        //若请求成功将响应的数据显示在页面上
            success: function (data) {
                $("#time").html(data)
            },
        }
    );
}

function get_c1_data() {
    $.ajax({
        url: "/center1",
        success: function (data) {
            //总感染人数
            $(".num h1").eq(0).text(data.confirm)
            //总疑似案例
            $(".num h1").eq(1).text(data.suspect)
            //总康复人数
            $(".num h1").eq(2).text(data.heal)
            //总死亡人数
            $(".num h1").eq(3).text(data.dead)
        }
    })
}
2.业务层
使用flask框架将前端请求的ur以及对应的业务逻辑处理函数添加到路由中,并将结果返回给客户端。get_time函数实现获取当前时间业务,get_c1_data实现获取疫情总数据业务,将数据以字典的形式封装并转化成json字符串响应给客户端。由于获取的总数据最终为bigdecima类型,jsonify是无法转化bigdecima类型的,所以需要将数据转化成int类型。Hello_word函数为页面入口函数,访问http://127.0.0.1:5000/即可进入主页面
@app.route('/time',methods=['GET'])
def get_time():
    #将当前时间返回给客户端
    return utils.get_time()

@app.route('/',methods=['GET'])
def Hello_word():
    return render_template("main.html")

@app.route('/center1',methods=['GET'])
def get_c1_data():
    data=utils.get_c1_data()
    #使用flask中的jsonify将字典转化成json字符串返回给客户端
    return jsonify({"confirm":int(data[0]),"suspect":int(data[1]),"heal":int(data[2]),"dead":int(data[3])})
3.数据访问层
utils工具类作为数据访问层,主要负责数据库的访问。博主这里是将感染总人数,案例总人数,康复总人数,死亡总人数总为关键字,所以在数据库获取数据的时候使用sum函数求和查询。
def get_time():
    #获取当前时间
    time_str=time.strftime("%Y{}%m{}%d{} %X".format("年","月","日"))
    return time_str

#获取连接
def get_connect():
    con = pymysql.connect(host="localhost", port=3306, user="root", passwd="root", db="newsqa", charset="utf8")
    cur = con.cursor()
    return con,cur

#关闭连接
def close_connect(con,cur):
    if con:
        con.close()
    if cur:
        cur.close()

#查询函数
def query(sql,*args):
    con,cur=get_connect()
    cur.execute(sql,args)
    res=cur.fetchall()
    close_connect(con,cur)
    return res

#从数据库中查询疫情总数据
def get_c1_data():
    sql="select sum(confirm)," \
        "(select suspect from history order by ds desc limit 1)," \
        "sum(heal)," \
        "sum(dead) " \
        "from details "\
        "where update_time=(select update_time from details order by update_time desc limit 1)"
    res=query(sql)
    return res[0]
3.3全国疫情地图的实现
3.3.1使用echart实现中国地图可视化
1.首先要给echarts提供一个容器。
<div id="center2">div>
2.实例化echarts对象
var ec_center=echarts.init(document.getElementById("center2"));
3.参数设置,mydata存放使用ajax请求后服务器响应给客户端的数据
var mydata=[]
option = {
    title: {
        text: '',
        subtext: '',
        x: 'left'
    },
    tooltip: {
        trigger: 'item'
    },
    legend: {
        orient: 'vertical',
        left: 'left',
        data: ['订单量']
    },
    visualMap: {
        type: 'piecewise',
        pieces: [
            {min: 500000},
            {min: 1000, max: 4999},
            {min: 500, max: 999},
            {min: 100, max: 499},
            {min: 10, max: 99},
            {min:1,max: 5}
        ],
        color: ['#8A0829', '#DF013A', '#FE2E64','#F78181','#F5A9A9','#FBEFEF']
    },
       roamController: {
        show: true,
        left: 'right',
        mapTypeControl: {
            'china': true
        }
    },

    series: [
        {
            name: '累计确诊人数',
            type: 'map',
            mapType: 'china',
            roam: false,
            label: {
                show: true,
                fontSize: 8
            },
            emphasis: {
                show:true,
                fontSize:8
            },
            itemStyle:{
              normal:{
                  borderWidth:0,
                  borderColor:"#009fe8",
                  areaColor:"#ffefd5"
              },
              emphasis:{
                  borderWidth:0,
                  borderColor:"#4b0082",
                  areaColor:"#fff"
              }


            },
            data: mydata
        }
    ]
};
4.引入js文件,在main.html引入js文件
<script src="../static/js/jquery-3.5.1.js">script>
<script src="../static/js/echarts.min.js">script>
<script src="../static/js/china.js">script>
<script src="../static/js/ec_center.js">script>
<script src="../static/js/controller.js">script>
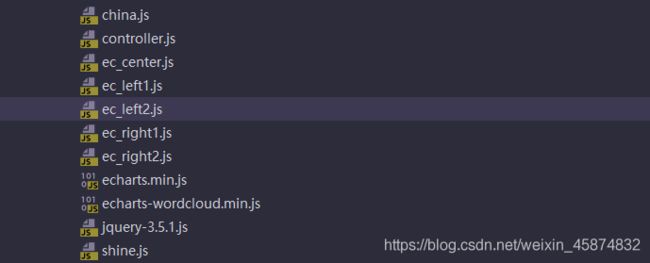
如何具体使用echart可在echarts官网查看。本文所用到的js文件如图,要实现中国地图显示需要用到china.js和echarts.min.js,实现词云图显示要用到echarts-wordcloud.min.js,可以在官网进行下载对应的js文件。
3.3.2疫情地图数据的显示
1.展示层
将从数据库获取的各个地区的疫情数据作为疫情地图的option参数,设置疫情地图参数即可。
function get_c2_data() {
    $.ajax({
        url: "/center2",
        success: function (data) {
            //将服务器响应给客户端的数据作为echarts的option参数
            en_center_option.series[0].data = data.data;
            //设置疫情地图的option
            ec_center.setOption(en_center_option);
        }
    });
}
2.业务层
将省份名称和对应的总感染人数以name,value形式封装在字典中,转化成json返回给客户端。
@app.route('/center2',methods=['GET'])
def get_c2_data():
    res=[]
    for tup in utils.get_c2_data():
        res.append({"name":tup[0],"value":int(tup[1])})
    return jsonify({"data":res})
3.数据访问层
以省份名称作为分组条件,分组查询每个省份总的感染人数
#从数据库中查询疫情详情数据
def get_c2_data():
    sql="select province_name,sum(confirm) from details " \
        "where update_time=(select update_time from details order by update_time desc limit 1)"\
        "group by province_name"
    res=query(sql)
    return res
3.4全国疫情累计趋势折线图显示
1.展示层
折线图显示同样也要设置实例的echart的option参数,这里博主就不写在博客上了,大家可以在官网上复制对应图形的option,对option里面的参数进行修改即可。
function get_l1_data() {
    $.ajax({
        url: "/left1",
        success: function (data) {
            ec_left1_option.xAxis.data=data.day;
            ec_left1_option.series[0].data=data.confirm;
            ec_left1_option.series[1].data=data.suspect;
            ec_left1_option.series[2].data=data.heal;
            ec_left1_option.series[3].data=data.dead;
            //设置疫情地图的option参数
            ec_left1.setOption(ec_left1_option);
        }
    });
}
2.业务层
由于疫情详情表中的前7条数据是空值,所以这里使用切片将它们去掉。
@app.route('/left1')
def get_l1_data():
    data=utils.get_l1_data()
    day,confirm,suspect,heal,dead=[],[],[],[],[]
    for a,b,c,d,e in data[7::]:
        day.append(a.strftime('%m-%d'))
        confirm.append(b)
        suspect.append(c)
        heal.append(d)
        dead.append(e)
    print(jsonify({"day":day,"confirm":confirm,"suspect":suspect,"heal":heal,"dead":dead}))
    return jsonify({"day":day,"confirm":confirm,"suspect":suspect,"heal":heal,"dead":dead})
3.数据访问层
查询history数据表中当前累计总数的所有记录
def get_l1_data():
    sql="select ds,confirm,suspect,heal,dead from history"
    res=query(sql)
    return res
3.4全国疫情新增趋势折线图显示
1.展示层
function get_l2_data() {
    $.ajax({
        url: "/left2",
        success: function (data) {
            ec_left2_option.xAxis.data=data.day;
            ec_left2_option.series[0].data=data.confirm_add;
            ec_left2_option.series[1].data=data.suspect_add;
            ec_left2_option.series[2].data=data.heal_add;
            ec_left2_option.series[3].data=data.dead_add;
            //设置疫情地图的option参数
            ec_left2.setOption(ec_left2_option);
        }
    });
}
2.业务层
@app.route('/left2')
def get_l2_data():
    data = utils.get_l2_data()
    day, confirm_add, suspect_add, heal_add, dead_add = [],[],[],[],[]
    for a, b, c, d, e in data[7::]:
        day.append(a.strftime('%m-%d'))
        confirm_add.append(b)
        suspect_add.append(c)
        heal_add.append(d)
        dead_add.append(e)
    return jsonify({"day":day,"confirm_add": confirm_add, "suspect_add": suspect_add, "heal_add": heal_add, "dead_add": dead_add})
3.数据访问层
查询history数据表中当前累计新增总数的所有记录
def get_l2_data():
    sql="select ds,confirm_add,suspect_add,heal_add,dead_add from history"
    res=query(sql)
    return res
3.5非湖北地区确诊Top5柱状图显示
1.展示层
function get_r1_data() {
    $.ajax({
        url: "/right1",
        success: function (data) {
            ec_right1_option.xAxis.data=data.province_name;
            ec_right1_option.series[0].data=data.confirm;
            //设置疫情地图的option参数
            ec_right1.setOption(ec_right1_option);
        }
    });
}
2.业务层
@app.route('/right1')
def get_r1_data():
    data=utils.get_r1_data()
    province_name=[]
    confirm=[]
    for tup in data:
        province_name.append(tup[0])
        confirm.append(int(tup[1]))
    return jsonify({"province_name":province_name,"confirm":confirm})
3.数据访问层
使用多表查询,将省份名称和对应的感染总人数作为新表a 的字段,并且省份中应不包含湖北,将感染总人数升序排序,查询前5条记录。
def get_r1_data():
    sql='select province_name,confirm from '\
        '(select province_name,confirm from details '\
        'where update_time=(select update_time from details order by update_time desc limit 1) ' \
        'and province_name not in ("湖北","北京","天津","上海","重庆") ' \
        'union all ' \
        'select province_name as province_name,sum(confirm) as confirm from details ' \
        'where update_time=(select update_time from details order by update_time desc limit 1) ' \
        'and province_name in ("北京","上海","天津","重庆") group by province_name) as a ' \
        'order by confirm desc limit 5'
    res=query(sql)
    return res
3.6百度热搜词云图显示
1.展示层
function get_r2_data() {
    $.ajax({
        url: "/right2",
        timeout: 2000,
        success: function (data) {
            ec_right2_option.series[0].data=data.keyword;
            //设置疫情地图的option参数
            ec_right2.setOption(ec_right2_option);
        }
    });
}
2.业务层
使用jieba模块中的exract_tags函数提取百度热搜中的关键字,并将热度作为关键字的权重,来展现关键字在词云图中的大小,关键字越大热度越高。
@app.route('/right2')
def get_r2_data():
    data=utils.get_r2_data()
    keyword=[]
    for tup in data:
        #使用jieba提取关键字
        key=extract_tags(tup[0])
        for i in key:
            keyword.append({"name":i,"value":tup[1]})
    return jsonify({"keyword":keyword})
3.数据访问层
def get_r2_data():
    sql="select context,heat from hotsearch"
    res=query(sql)
    return res
4.使用爬虫脚本对疫情数据进行实时更新
爬虫脚本是在原有的脚本基础上在进行了一些小的改动,由于需要将数据库中的历史数据和详情数据进行更新,所以在数据更新和插入操作时要获取数据库中最新时间的数据,再和爬取的数据进行对比,如果一样就代表是最新数据,不用更新数据,如果不一样就更新数据库表。如果没有将项目部署到Linux服务器上,可以每天手动执行一次脚本,获取当天的数据,如果项目部署到了服务器上可以使用Linux的crontab定时调度爬虫脚本,至于项目如何部署以及crontab如何编写,博主会在后续更新在博客上。
import requests
import json
import pymysql
import time
import traceback
from selenium import webdriver
import sys

def get_cov_data():
    #详情数据url
    details_url=' https://view.inews.qq.com/g2/getOnsInfo?name=disease_h5'
    #历史数据url
    history_url='https://api.inews.qq.com/newsqa/v1/query/inner/publish/modules/list?modules=chinaDayList,chinaDayAddList,nowConfirmStatis,provinceCompare'
    headers='Mozilla/5.0 (Windows NT 10.0; Win64; x64) AppleWebKit/537.36 (KHTML, like Gecko) Chrome/89.0.4350.7 Safari/537.36'
    details_response=requests.get(details_url,headers)
    #将获取的详情数据json字符串转化成字典
    details_json=json.loads(details_response.text)
    #key为data的json字符串转化成字典
    details_dic=json.loads(details_json['data'])
    history_response=requests.get(history_url,headers)
    #将历史数据json字符串转化成字典
    history_dic=json.loads(history_response.text)['data']
    history={}
    details = []
    #将历史数据保存
    for i in history_dic['chinaDayList']:
        date=i['y']+'.'+i['date']
        tup=time.strptime(date,'%Y.%m.%d')
        #改变时间格式不然插入数据时数据库会报错
        date=time.strftime('%Y-%m-%d',tup)
        confirm=i['confirm']
        suspect=i['suspect']
        dead=i['dead']
        heal=i['heal']
        history[date]={"confirm":confirm,"suspect":suspect,"heal":heal,"dead":dead}
    #将历史当天新增数据保存
    for i in history_dic['chinaDayAddList']:
        date=i['y']+'.'+i['date']
        tup=time.strptime(date,'%Y.%m.%d')
        date=time.strftime('%Y-%m-%d',tup)
        confirm=i['confirm']
        suspect=i['suspect']
        dead=i['dead']
        heal=i['heal']
        history[date].update({"confirm_add":confirm,"suspect_add":suspect,"heal_add":heal,"dead_add":dead})

    update_time=details_dic['lastUpdateTime']
    data_countries=details_dic['areaTree']
    #获取省级数据列表
    data_provinces=data_countries[0]['children']
    #将详情数据保存
    for pro_info in data_provinces:
        provinces_name=pro_info['name']
        for city_info in pro_info['children']:
            city_name=city_info['name']
            confirm=city_info['total']['confirm']
            confirm_add=city_info['today']['confirm']
            heal=city_info['total']['heal']
            dead=city_info['total']['dead']
            details.append([update_time,provinces_name,city_name,confirm,confirm_add,heal,dead])
    return history,details

def get_search_data():
    #设置无头浏览器
    options = webdriver.ChromeOptions()
    options.add_argument('--headless')
    options.add_argument('--disable-gpu')
    #实例谷歌浏览器对象
    browser = webdriver.Chrome(executable_path=r'C:\Users\a南\PycharmProjects\PythonProject\python爬虫\code\chromedriver.exe',options=options)
    url="http://top.baidu.com/buzz/shijian.html"
    #get请求百度热搜榜url
    browser.get(url)
    tr=browser.find_elements_by_tag_name("tr")
    context=[]
    #获取每个热搜的标题以及对应的热度,并封装在字典中
    for i in range(2,len(tr)+1):
        title=browser.find_element_by_xpath('//table[@class="list-table"]/tbody/tr['+str(i)+']//td[@class="keyword"]').text
        heat=browser.find_element_by_xpath('//table[@class="list-table"]/tbody/tr['+str(i)+']//td[@class="last"]').text
        context.append({"title":title,"heat":heat})
    return context
    browser.close()


#获取连接
def get_connect():
    con = pymysql.connect(host="localhost", port=3306, user="root", passwd="root", db="newsqa", charset="utf8")
    cur = con.cursor()
    return con,cur

#关闭连接
def close_connect(con,cur):
    if con:
        con.close()
    if cur:
        cur.close()

#保存详情数据到数据库中
def up_details():
    con=None
    cur=None
    try:
        li=get_cov_data()[1]
        con,cur=get_connect()
        sql="update details set update_time=%s,confirm=%s,confirm_add=%s,heal=%s,dead=%s  where province_name=%s and city_name=%s"
        sql_query="select %s=(select update_time from details order by id desc limit 1)"
        cur.execute(sql_query,li[0][0])
        if not cur.fetchone()[0]:
            print(f"{time.asctime()}开始更新详情最新数据")
            for item in li:
                cur.execute(sql,(item[0],item[3],item[4],item[5],item[6],item[1],item[2]))
            con.commit()
            print(f"{time.asctime()}更新详情最新数据完毕")
        else:
            print(f"{time.asctime()}详情表已是最新数据")
    except:
        traceback.print_exc()
    finally:
        close_connect(con,cur)

#保存历史数据到数据库中
def up_history():
    con=None
    cur=None
    try:
        li=get_cov_data()[0].items()
        con,cur=get_connect()
        sql="insert into history(ds,confirm,confirm_add,suspect,suspect_add,heal,heal_add,dead,dead_add) values(%s,%s,%s,%s,%s,%s,%s,%s,%s)"
        sql_query="select confirm from history where ds=%s"
        for k,v in li:
            if not cur.execute(sql_query,k):
                print(f"{time.asctime()}开始更新历史最新数据")
                cur.execute(sql,[k,v.get('confirm'),v.get('confirm_add'),v.get('suspect'),v.get('suspect_add'),v.get('heal'),v.get('heal_add'),v.get('dead'),v.get('dead_add')])
        print(f"{time.asctime()}历史数据更新完毕")
        con.commit()
    except:
        traceback.print_exc()
    finally:
        close_connect(con,cur)

def up_search():
    con,cur=None,None
    try:
        context=get_search_data()
        con,cur=get_connect()
        sql="insert into hotsearch(ds,context,heat) values(%s,%s,%s)"
        for i in context:
            cur.execute(sql,(time.strftime("%Y-%m-%d %X"),i.get('title'),i.get('heat')))
            con.commit()
        print("热搜数据更新完毕")
    except:
        traceback.print_exc()
    finally:
        close_connect(con,cur)


if __name__ == '__main__':
    up_details()
    up_history()
    up_search()
5.最终界面显示
结语
本项目博主是参考了b站的一个教学视频,大家有兴趣可以去看一下,Python爬取疫情实战,并且仅供学习使用,如果本篇文章对你有用的话,别忘了给博主一个三连哦。
项目演示地址:疫情监控

