吴恩达深度学习笔记(五)——优化算法
一、mini_batch梯度下降法
如果使用batch梯度下降法,mini-batch的大小为m,每个迭代需要处理大量的训练样本,弊端在于巡林样本巨大的时候,单次迭代耗时过长。
如果使用随机梯度下降法(mini-batch为1),只处理一个样本,通过减小学习率,噪声得到改善或者减小。缺点是失去向量化带来的加速,效率低下。且永远不会收敛,会一直在最小值附近波动,并不会达到最小值并停留在此。
所以实践中,通常选择不大不小的mini-batch尺寸。一方面,得到了大量向量化,比一次性处理多个样本快得多。另一方面,不需要等待整个训练集被处理完就可以开始后续工作。mini-batch梯度下降法不会总朝向最小值靠近,但比随机梯度下降更持续的靠近最小值的方向,也不一定在很小的范围内收敛或波动,如果出现这个问题,可以慢慢减少学习率。
mini-batch的选取指导原则:
如果训练集较小,直接使用batch梯度下降法,比如少于2000个样本;
样本数目较大的话,一般的mini-batch大小设置为64到512。考虑到电脑内存设置和使用的方式,mini-batch大小为2的n次方,代码运行的会快一些。
二、指数加权平均数
指数加权移动平均(Exponentially Weighted Moving Average),他是一种常用的序列处理方式。在 t t t时刻,他的移动平均值公式是: V t = β V t − 1 + ( 1 − β ) θ t V_{t}=\beta V_{t-1}+(1-\beta) \theta_{t} Vt=βVt−1+(1−β)θt , t = 1 , 2 , 3 , . . . n t=1,2,3,...n t=1,2,3,...n ,其中 V t V_{t} Vt是 t t t时刻的移动平均预测值; θ t \theta_{t} θt为 t t t时刻的真实值; β \beta β是权重;
以下该链接有β与平均多少天之间的关系:
参考链接
偏差修正:
在估测初期,不用 v t v_{t} vt,而是用 v t 1 − β t \frac{v_{t}}{1-\beta _{t}} 1−βtvt
但在机器学习中,大部分时候并不在乎执行偏差修正,熬过初始时期,继续计算。
三、动量梯度下降法(momentum)
对于梯度下降法,很可能会出现上图那样的情况,需要很多的计算步骤。这种上下的波动会减慢梯度下降法的速度,无法使用更大的学习率(否则摆动较大,紫色箭头),就只能使用较小的学习率。但从横轴来说,希望加快学习,能够快速从左到右,移动到最小值。
注:
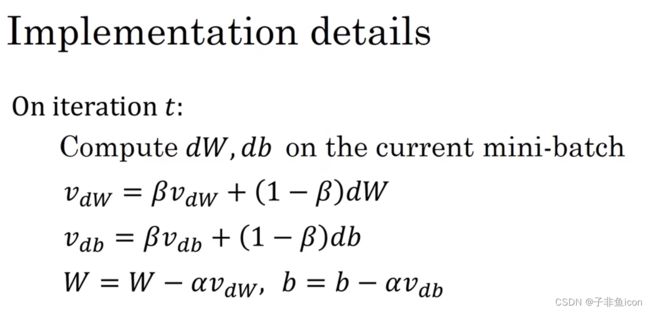
1. β \beta β最常用的值是0.9,是很棒的鲁棒数。
2.关于偏差校正,一般也不会进行。因为10次迭代后,移动平均已经过了初始阶段。
3. v d w v_{dw} vdw是维数和 d w dw dw, w相同的零矩阵。
4.有的资料会把后面的项 1 − β 1-\beta 1−β删除,这导致的结果是:学习率 α \alpha α要根据 1 1 − β \frac{1}{1-\beta} 1−β1相应变化。
四、RMSprop
RMSprop也可以加速梯度下降。
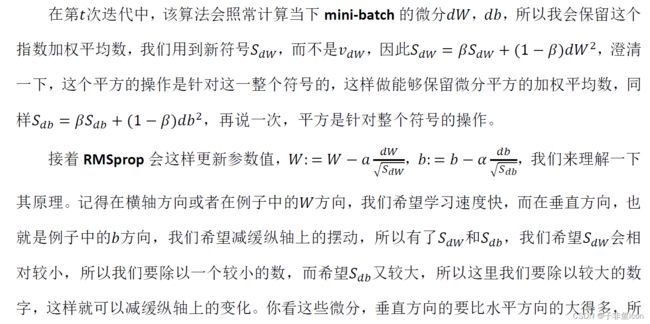
假设纵轴是b,横轴是W,虽然横轴方向在缓慢推进,但纵轴方向会有大幅度地摆动。RMSprop就能减缓b方向的学习,加快横轴的学习。
简单解释一下就是:db大,所以算得的Sab也大,b的更新式除以了一个较大的数,所以减缓了b的摆动。蓝色的前进曲线被压缩为绿色的:

注:如果 S d w S_{dw} Sdw的平方根趋近于0,要确保算法不会除以0,所以就要在分母上加上一个很小很小的数 ϵ \epsilon ϵ,比如 1 0 − 8 10^{-8} 10−8,保证数值稳定。
五、Adam优化算法
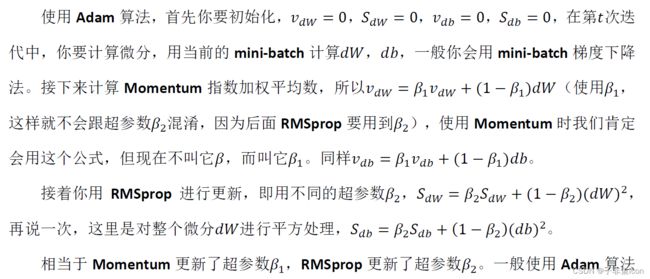
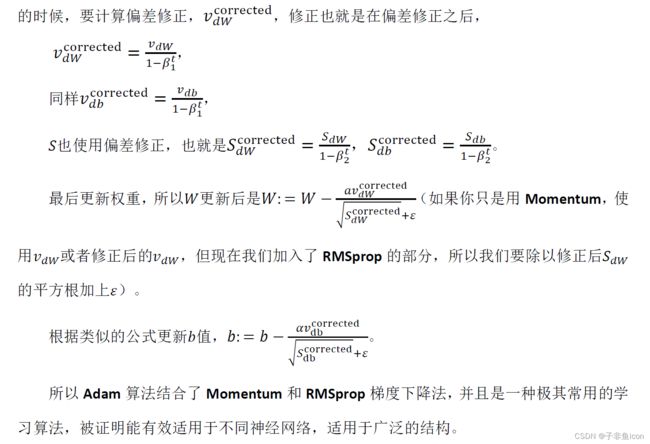
结合了Momentum和RMSprop
β 1 \beta _{1} β1:0.9
β 2 \beta _{2} β2:0.999
ϵ \epsilon ϵ: 1 0 − 8 10^{-8} 10−8
六、学习率衰减
加快学习算法的一个办法就是:随时间慢慢减少学习率。
蓝色线:使用mini-batch梯度下降法,在迭代过程中,存在着噪音,下降朝向最小值,但不会精确收敛,在附近摆动。这是因为用的 α \alpha α是固定值。
绿色线:但如果随着 α \alpha α变小,步伐也会变小,最后曲线会在最小值附近很小的一块区域内摆动。
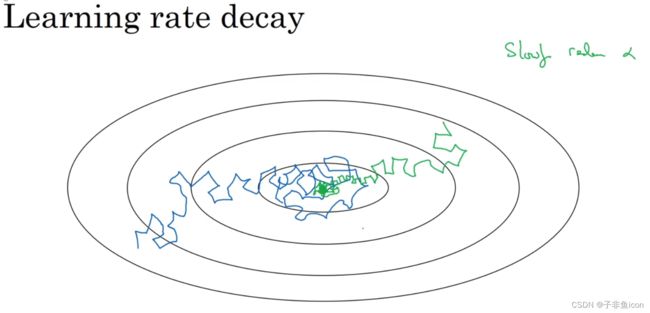
拆分成不同的mini-batch,第一次遍历训练集叫做第一代。

其他的一些衰减方式:
1. α = 0.9 5 e p o c h − n u m α 0 \alpha=0.95^{epoch-num}\alpha_{0} α=0.95epoch−numα0
2. α = k e p o c h − n u m α 0 \alpha=\frac{k}{\sqrt {epoch-num}} \alpha_{0} α=epoch−numkα0或者 α = k t α 0 \alpha=\frac{k}{\sqrt {t} }\alpha_{0} α=tkα0(t为mini-batch 的数字)
3.离散下降,一次减少一半。
七、局部最优的问题
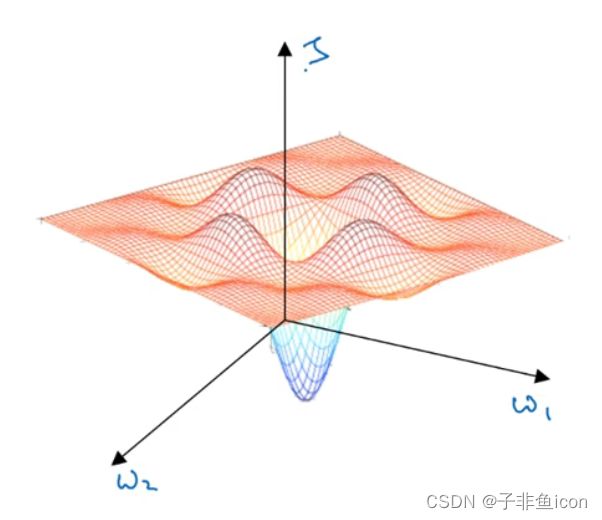
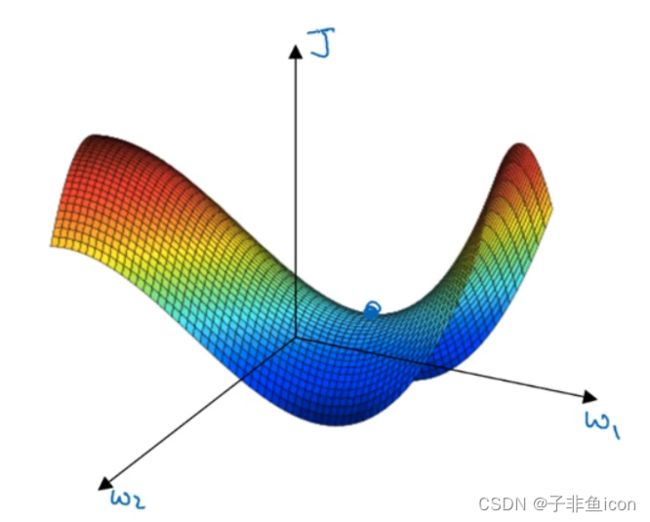
通常梯度为0的点并不是图1中的局部最优点,实际上,成本函数的零梯度点,通常是鞍点。
即一个具有高维度空间的函数,如果梯度为0,在每个方向,它可能是凸函数,也可能是凹函数。因此吗,更可能碰到鞍点。
但平稳段是一个问题,这会使得学习十分缓慢,所以Mmomentum或者RMSprop、Adam才要加速学习算法。
八、编程作业
参考链接
opt_utils.py
import numpy as np
import matplotlib.pyplot as plt
import sklearn
import sklearn.datasets

def sigmoid(x):
    """
    Compute the sigmoid of x

    Arguments:
    x -- A scalar or numpy array of any size.

    Return:
    s -- sigmoid(x)
    """
    s = 1/(1+np.exp(-x))
    return s

def relu(x):
    """
    Compute the relu of x

    Arguments:
    x -- A scalar or numpy array of any size.

    Return:
    s -- relu(x)
    """
    s = np.maximum(0,x)

    return s


def load_params_and_grads(seed=1):
    np.random.seed(seed)
    W1 = np.random.randn(2,3)
    b1 = np.random.randn(2,1)
    W2 = np.random.randn(3,3)
    b2 = np.random.randn(3,1)

    dW1 = np.random.randn(2,3)
    db1 = np.random.randn(2,1)
    dW2 = np.random.randn(3,3)
    db2 = np.random.randn(3,1)

    return W1, b1, W2, b2, dW1, db1, dW2, db2

def initialize_parameters(layer_dims):
    """
    Arguments:
    layer_dims -- python array (list) containing the dimensions of each layer in our network

    Returns:
    parameters -- python dictionary containing your parameters "W1", "b1", ..., "WL", "bL":
                    W1 -- weight matrix of shape (layer_dims[l], layer_dims[l-1])
                    b1 -- bias vector of shape (layer_dims[l], 1)
                    Wl -- weight matrix of shape (layer_dims[l-1], layer_dims[l])
                    bl -- bias vector of shape (1, layer_dims[l])

    Tips:
    - For example: the layer_dims for the "Planar Data classification model" would have been [2,2,1].
    This means W1's shape was (2,2), b1 was (1,2), W2 was (2,1) and b2 was (1,1). Now you have to generalize it!
    - In the for loop, use parameters['W' + str(l)] to access Wl, where l is the iterative integer.
    """

    np.random.seed(3)
    parameters = {}
    L = len(layer_dims) # number of layers in the network

    for l in range(1, L):
        parameters['W' + str(l)] = np.random.randn(layer_dims[l], layer_dims[l-1])*  np.sqrt(2 / layer_dims[l-1])
        parameters['b' + str(l)] = np.zeros((layer_dims[l], 1))

        assert(parameters['W' + str(l)].shape == layer_dims[l], layer_dims[l-1])
        assert(parameters['W' + str(l)].shape == layer_dims[l], 1)

    return parameters

def forward_propagation(X, parameters):
    """
    Implements the forward propagation (and computes the loss) presented in Figure 2.

    Arguments:
    X -- input dataset, of shape (input size, number of examples)
    parameters -- python dictionary containing your parameters "W1", "b1", "W2", "b2", "W3", "b3":
                    W1 -- weight matrix of shape ()
                    b1 -- bias vector of shape ()
                    W2 -- weight matrix of shape ()
                    b2 -- bias vector of shape ()
                    W3 -- weight matrix of shape ()
                    b3 -- bias vector of shape ()

    Returns:
    loss -- the loss function (vanilla logistic loss)
    """

    # retrieve parameters
    W1 = parameters["W1"]
    b1 = parameters["b1"]
    W2 = parameters["W2"]
    b2 = parameters["b2"]
    W3 = parameters["W3"]
    b3 = parameters["b3"]

    # LINEAR -> RELU -> LINEAR -> RELU -> LINEAR -> SIGMOID
    z1 = np.dot(W1, X) + b1
    a1 = relu(z1)
    z2 = np.dot(W2, a1) + b2
    a2 = relu(z2)
    z3 = np.dot(W3, a2) + b3
    a3 = sigmoid(z3)

    cache = (z1, a1, W1, b1, z2, a2, W2, b2, z3, a3, W3, b3)

    return a3, cache

def backward_propagation(X, Y, cache):
    """
    Implement the backward propagation presented in figure 2.

    Arguments:
    X -- input dataset, of shape (input size, number of examples)
    Y -- true "label" vector (containing 0 if cat, 1 if non-cat)
    cache -- cache output from forward_propagation()

    Returns:
    gradients -- A dictionary with the gradients with respect to each parameter, activation and pre-activation variables
    """
    m = X.shape[1]
    (z1, a1, W1, b1, z2, a2, W2, b2, z3, a3, W3, b3) = cache

    dz3 = 1./m * (a3 - Y)
    dW3 = np.dot(dz3, a2.T)
    db3 = np.sum(dz3, axis=1, keepdims = True)

    da2 = np.dot(W3.T, dz3)
    dz2 = np.multiply(da2, np.int64(a2 > 0))
    dW2 = np.dot(dz2, a1.T)
    db2 = np.sum(dz2, axis=1, keepdims = True)

    da1 = np.dot(W2.T, dz2)
    dz1 = np.multiply(da1, np.int64(a1 > 0))
    dW1 = np.dot(dz1, X.T)
    db1 = np.sum(dz1, axis=1, keepdims = True)

    gradients = {"dz3": dz3, "dW3": dW3, "db3": db3,
                 "da2": da2, "dz2": dz2, "dW2": dW2, "db2": db2,
                 "da1": da1, "dz1": dz1, "dW1": dW1, "db1": db1}

    return gradients

def compute_cost(a3, Y):

    """
    Implement the cost function

    Arguments:
    a3 -- post-activation, output of forward propagation
    Y -- "true" labels vector, same shape as a3

    Returns:
    cost - value of the cost function
    """
    m = Y.shape[1]

    logprobs = np.multiply(-np.log(a3),Y) + np.multiply(-np.log(1 - a3), 1 - Y)
    cost = 1./m * np.sum(logprobs)

    return cost

def predict(X, y, parameters):
    """
    This function is used to predict the results of a  n-layer neural network.

    Arguments:
    X -- data set of examples you would like to label
    parameters -- parameters of the trained model

    Returns:
    p -- predictions for the given dataset X
    """

    m = X.shape[1]
    p = np.zeros((1,m), dtype = np.int)

    # Forward propagation
    a3, caches = forward_propagation(X, parameters)

    # convert probas to 0/1 predictions
    for i in range(0, a3.shape[1]):
        if a3[0,i] > 0.5:
            p[0,i] = 1
        else:
            p[0,i] = 0

    # print results

    #print ("predictions: " + str(p[0,:]))
    #print ("true labels: " + str(y[0,:]))
    print("Accuracy: "  + str(np.mean((p[0,:] == y[0,:]))))

    return p

def predict_dec(parameters, X):
    """
    Used for plotting decision boundary.

    Arguments:
    parameters -- python dictionary containing your parameters
    X -- input data of size (m, K)

    Returns
    predictions -- vector of predictions of our model (red: 0 / blue: 1)
    """

    # Predict using forward propagation and a classification threshold of 0.5
    a3, cache = forward_propagation(X, parameters)
    predictions = (a3 > 0.5)
    return predictions

def plot_decision_boundary(model, X, y):
    # Set min and max values and give it some padding
    x_min, x_max = X[0, :].min() - 1, X[0, :].max() + 1
    y_min, y_max = X[1, :].min() - 1, X[1, :].max() + 1
    h = 0.01
    # Generate a grid of points with distance h between them
    xx, yy = np.meshgrid(np.arange(x_min, x_max, h), np.arange(y_min, y_max, h))
    # Predict the function value for the whole grid
    Z = model(np.c_[xx.ravel(), yy.ravel()])
    Z = Z.reshape(xx.shape)
    # Plot the contour and training examples
    plt.contourf(xx, yy, Z, cmap=plt.cm.Spectral)
    plt.ylabel('x2')
    plt.xlabel('x1')
    plt.scatter(X[0, :], X[1, :], c=y, cmap=plt.cm.Spectral)
    plt.show()

def load_dataset(is_plot = True):
    np.random.seed(3)
    train_X, train_Y = sklearn.datasets.make_moons(n_samples=300, noise=.2) #300 #0.2
    # Visualize the data
    if is_plot:
        plt.scatter(train_X[:, 0], train_X[:, 1], c=train_Y, s=40, cmap=plt.cm.Spectral)
        plt.show()
    train_X = train_X.T
    train_Y = train_Y.reshape((1, train_Y.shape[0]))

    return train_X, train_Y
实现代码:
import numpy as np
import matplotlib.pyplot as plt
import scipy.io
import math
import sklearn
import sklearn.datasets

import opt_utils
import testCase

plt.rcParams['figure.figsize'] = (7.0, 4.0) # set default size of plots
plt.rcParams['image.interpolation'] = 'nearest'
plt.rcParams['image.cmap'] = 'gray'

# 梯度下降
def update_parameters_with_gd(parameters, grads, learning_rate):

    L = len(parameters) // 2

    for l in range(L):

        parameters["W" + str(l+1)] = parameters["W" + str(l+1)] - learning_rate * grads["dW" + str(l+1)]
        parameters["b" + str(l+1)] = parameters["b" + str(l+1)] - learning_rate * grads["db" + str(l+1)]

    return parameters

# 实现mini-batch
def random_mini_batches(X, Y, mini_batch_size=64, seed=0):

    np.random.seed(seed)
    m = X.shape[1]
    mini_batches = []

    # 先打乱顺序
    permutation = list(np.random.permutation(m)) # #它会返回一个长度为m的随机数组,且里面的数是0到m-1;这里不用list也行
    shuffle_X = X[:, permutation]
    shuffle_Y = Y[:, permutation].reshape((1, m))

    # 分割
    num_complete_minibatches = math.floor(m / mini_batch_size) # 向下取整,一共分成了多少份

    for k in range(0, num_complete_minibatches):

        mini_batch_X = shuffle_X[:, k*mini_batch_size:(k+1) * mini_batch_size]
        mini_batch_Y = shuffle_Y[:, k * mini_batch_size:(k + 1) * mini_batch_size]

        mini_batch = (mini_batch_X, mini_batch_Y)
        mini_batches.append(mini_batch)

    # 处理没有被平分的剩余部分
    if m % mini_batch_size != 0:

        mini_batch_X = shuffle_X[:, num_complete_minibatches * mini_batch_size:]
        mini_batch_Y = shuffle_Y[:, num_complete_minibatches * mini_batch_size:]

        mini_batch = (mini_batch_X, mini_batch_Y)
        mini_batches.append(mini_batch)

    return mini_batches

# 初始化,包含动量的梯度下降,建立一个和dW、db相同结构的变量来影响他们
def initialize_velocity(parameters):

    L = len(parameters) // 2
    v = {}

    for l in range(L):

        v["dW" + str(l + 1)] = np.zeros_like(parameters["W" + str(l + 1)])
        v["db" + str(l + 1)] = np.zeros_like(parameters["b" + str(l + 1)])

    return v

# 实现动量梯度下降
def update_parameters_with_momentum(parameters, grads, v, beta, learning_rate):

    L = len(parameters) // 2

    for l in range(L):

        v["dW" + str(l + 1)] = beta * v["dW" + str(l + 1)] + (1 - beta) * grads["dW" + str(l + 1)]
        parameters["W" + str(l + 1)] = parameters["W" + str(l + 1)] - learning_rate * v["dW" + str(l + 1)]

        v["db" + str(l + 1)] = beta * v["db" + str(l + 1)] + (1 - beta) * grads["db" + str(l + 1)]
        parameters["b" + str(l + 1)] = parameters["b" + str(l + 1)] - learning_rate * v["db" + str(l + 1)]

    return parameters, v

# 初始化,Adam算法
def initialize_adam(parameters):

    L = len(parameters) // 2
    v = {}
    s = {}

    for l in range(L):

        v["dW" + str(l + 1)] = np.zeros_like(parameters["W" + str(l + 1)])
        v["db" + str(l + 1)] = np.zeros_like(parameters["b" + str(l + 1)])

        s["dW" + str(l + 1)] = np.zeros_like(parameters["W" + str(l + 1)])
        s["db" + str(l + 1)] = np.zeros_like(parameters["b" + str(l + 1)])

    return (v, s)

# 实现Adam算法
def update_parameters_with_adam(parameters, grads, v, s, t, learning_rate=0.1, beta1=0.9, beta2=0.999, epsilon=1e-8):

    L = len(parameters) // 2
    v_corrected = {}
    s_corrected = {}

    for l in range(L):

        v["dW" + str(l + 1)] = beta1 * v["dW" + str(l + 1)] + (1 - beta1) * grads["dW" + str(l + 1)]
        v_corrected["dW" + str(l + 1)] = v["dW" + str(l + 1)] / (1 - np.power(beta1, t))
        s["dW" + str(l + 1)] = beta2 * s["dW" + str(l + 1)] + (1 - beta2) * np.square(grads["dW" + str(l + 1)])
        s_corrected["dW" + str(l + 1)] = s["dW" + str(l + 1)] / (1 - np.power(beta2, t))
        # parameters["W" + str(l + 1)] = parameters["W" + str(l + 1)] - learning_rate * v_corrected["dW" + str(l + 1)] / (np.sqrt(s_corrected["dW" + str(l + 1)]) + epsilon)
        parameters["W" + str(l + 1)] = parameters["W" + str(l + 1)] - learning_rate * (v_corrected["dW" + str(l + 1)] /
                    np.sqrt(s_corrected["dW" + str(l + 1)] + epsilon)) # 将epsilon写在根号里面

        v["db" + str(l + 1)] = beta1 * v["db" + str(l + 1)] + (1 - beta1) * grads["db" + str(l + 1)]
        v_corrected["db" + str(l + 1)] = v["db" + str(l + 1)] / (1 - np.power(beta1, t))
        s["db" + str(l + 1)] = beta2 * s["db" + str(l + 1)] + (1 - beta2) * np.square(grads["db" + str(l + 1)])
        s_corrected["db" + str(l + 1)] = s["db" + str(l + 1)] / (1 - np.power(beta2, t))
        # parameters["b" + str(l + 1)] = parameters["b" + str(l + 1)] - learning_rate * v_corrected["db" + str(l + 1)] / (np.sqrt(s_corrected["db" + str(l + 1)]) + epsilon)
        parameters["b" + str(l + 1)] = parameters["b" + str(l + 1)] - learning_rate * (v_corrected["db" + str(l + 1)] /
            np.sqrt(s_corrected["db" + str(l + 1)] + epsilon))

    return (parameters, v, s)


# 测试
# 加载数据集
train_X, train_Y = opt_utils.load_dataset(is_plot=True)

# 定义模型
def model(X, Y, layers_dims, optimizer, learning_rate=0.0007, mini_batch_size=64, beta1=0.9, beta2=0.999, epsilon=1e-8, num_epochs=10000, print_cost=True, is_plot=True):

    L = len(layers_dims)
    costs = []
    t = 0 # 每学习一个mini-batch,t就加一
    seed = 10

    parameters = opt_utils.initialize_parameters(layers_dims)

    # 选择优化器
    if optimizer == "gd":
        pass
    elif optimizer == "momentum":
        v = initialize_velocity(parameters)
    elif optimizer == "adam":
        v, s = initialize_adam(parameters)
    else:
        print("optimizer参数错误,程序退出。")
        exit(1)

    for i in range(num_epochs):

        seed = seed + 1 # 每次遍历完数据集后,重新排列数据集
        minibatches = random_mini_batches(X, Y, mini_batch_size, seed)

        for minibatch in minibatches:

            (minibatch_X, minibatch_Y) = minibatch

            A3, cache = opt_utils.forward_propagation(minibatch_X, parameters)

            cost = opt_utils.compute_cost(A3, minibatch_Y)

            grads = opt_utils.backward_propagation(minibatch_X, minibatch_Y, cache)

            # 更新参数
            if optimizer == "gd":
                parameters = update_parameters_with_gd(parameters, grads, learning_rate)
            elif optimizer == "momentum":
                parameters, v = update_parameters_with_momentum(parameters, grads, v, beta1, learning_rate)
            elif optimizer == "adam":
                t = t + 1
                parameters, v, s = update_parameters_with_adam(parameters, grads, v, s, t, learning_rate, beta1, beta2, epsilon)

        if i % 100 == 0:
            costs.append(cost)
            if print_cost and i % 1000 == 0:
                print("第" + str(i) + "次遍历整个数据集,当前误差值:" + str(cost))

    if is_plot:
        plt.plot(costs)
        plt.ylabel('cost')
        plt.xlabel('epochs (per 100)')
        plt.title("Learning rate = " + str(learning_rate))
        plt.show()

    return parameters


layers_dims = [train_X.shape[0], 5, 2, 1]
# 使用普通的梯度下降
#parameters = model(train_X, train_Y, layers_dims, optimizer="gd",is_plot=True)
#使用动量的梯度下降
#parameters = model(train_X, train_Y, layers_dims, beta1=0.9, optimizer="momentum", is_plot=True)
#使用Adam优化的梯度下降
parameters = model(train_X, train_Y, layers_dims, optimizer="adam", is_plot=True)

#预测
preditions = opt_utils.predict(train_X,train_Y,parameters)

#绘制分类图
#plt.title("Model with Gradient Descent optimization")
axes = plt.gca()
axes.set_xlim([-1.5, 2.5])
axes.set_ylim([-1, 1.5])
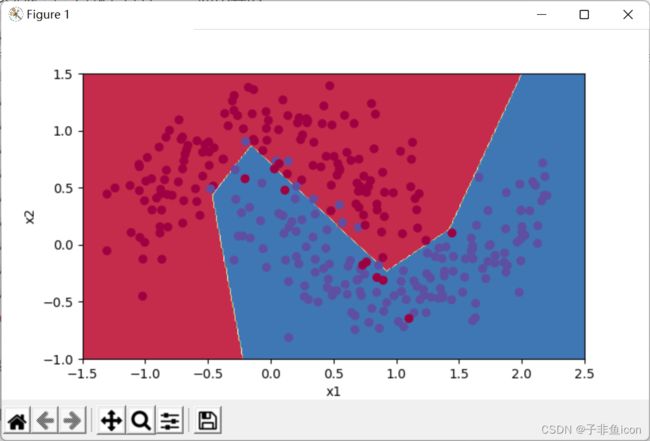
opt_utils.plot_decision_boundary(lambda x: opt_utils.predict_dec(parameters, x.T), train_X, train_Y)
8.1. 使用普通的梯度下降
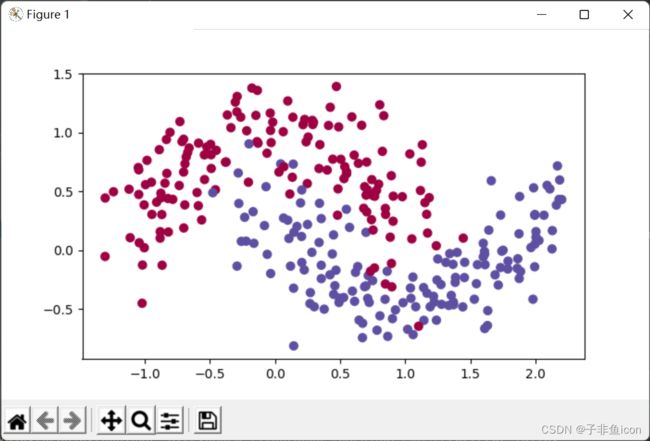
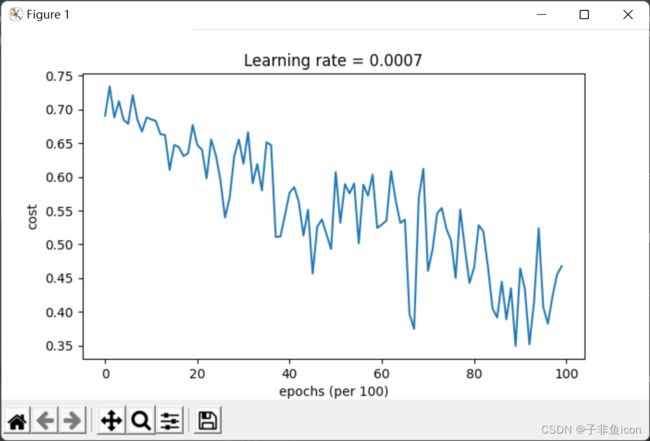
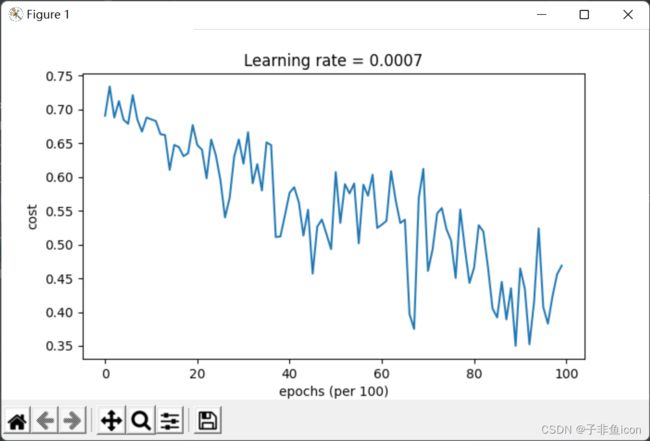
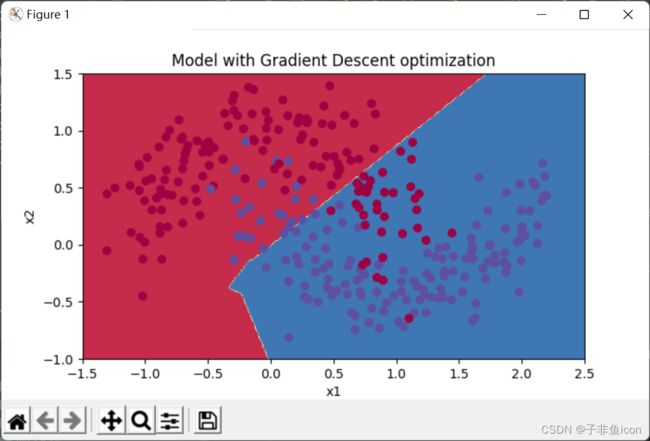
震荡原因:每个子训练集收敛的方向不一定和总训练集收敛方向相同(有时候甚至相反),所以会震荡。但是因为训练总是遍历了总训练集,所以虽然震荡但还是向cost小的方向收敛
第0次遍历整个数据集,当前误差值:0.690735512291113
第1000次遍历整个数据集,当前误差值:0.6852725328458241
第2000次遍历整个数据集,当前误差值:0.6470722240719003
第3000次遍历整个数据集,当前误差值:0.6195245549970402
第4000次遍历整个数据集,当前误差值:0.5765844355950945
第5000次遍历整个数据集,当前误差值:0.6072426395968576
第6000次遍历整个数据集,当前误差值:0.5294033317684576
第7000次遍历整个数据集,当前误差值:0.46076823985930115
第8000次遍历整个数据集,当前误差值:0.465586082399045
第9000次遍历整个数据集,当前误差值:0.4645179722167684
Accuracy: 0.7966666666666666
第0次遍历整个数据集,当前误差值:0.6907412988351506
第1000次遍历整个数据集,当前误差值:0.6853405261267578
第2000次遍历整个数据集,当前误差值:0.6471448370095255
第3000次遍历整个数据集,当前误差值:0.6195943032076022
第4000次遍历整个数据集,当前误差值:0.5766650344073023
第5000次遍历整个数据集,当前误差值:0.607323821900647
第6000次遍历整个数据集,当前误差值:0.5294761758786997
第7000次遍历整个数据集,当前误差值:0.46093619004872366
第8000次遍历整个数据集,当前误差值:0.465780093701272
第9000次遍历整个数据集,当前误差值:0.4647395967922748
Accuracy: 0.7966666666666666
因为这个例子比较简单,使用动量效果很小,但对于更复杂的问题,会有更好的效果。
8.3. 使用Adam的梯度下降
第0次遍历整个数据集,当前误差值:0.6905522446113365
第1000次遍历整个数据集,当前误差值:0.18550136438550574
第2000次遍历整个数据集,当前误差值:0.15083046575253212
第3000次遍历整个数据集,当前误差值:0.07445438570997179
第4000次遍历整个数据集,当前误差值:0.1259591565133716
第5000次遍历整个数据集,当前误差值:0.10434443534245479
第6000次遍历整个数据集,当前误差值:0.10067637504120656
第7000次遍历整个数据集,当前误差值:0.0316520301351156
第8000次遍历整个数据集,当前误差值:0.11197273131244208
第9000次遍历整个数据集,当前误差值:0.19794007152465498
Accuracy: 0.94
具有动量的梯度下降通常可以有很好的效果,但由于小的学习速率和简单的数据集所以它的影响几乎是轻微的。另一方面,Adam明显优于小批量梯度下降和具有动量的梯度下降,如果在这个简单的模型上运行更多时间的数据集,这三种方法都会产生非常好的结果,然而,我们已经看到Adam收敛得更快。
np.random.permutation()函数


