非线性支持向量机
非线性支持向量机
- 概述
- 实验步骤
-
- 1 安装并导入所需要的库
- 2 创建数据集
- 3 核函数
-
- 几种常见的核函数
-
- 1 线性核:Linear Kernel
- 2 多项式核:Polynomial Kernel
- 3 高斯核:Gaussian Kernel
- 4 三维图来表示开头数据的维度
- 5 sklearn实现SVM RBF分类
概述
SVM 最早是由 Vladimir N. Vapnik 和 Alexey Ya. Chervonenkis 在1963年提出,目前的版本(soft margin)是由 Corinna Cortes 和 Vapnik 在1993年提出,并在1995年发表。深度学习(2012)出现之前,SVM 被认为机器学习中近十几年来最成功,表现最好的算法。
支持向量机(support vector machines,SVM)是一种二分类模型,当然如果进行修改之后也是可以用于多类别问题的分类。它的基本类型是定义在特征空间上的间隔最大的线性分类器。支持向量机可以通过核技巧,转换成非线性分类器。它属于二分类算法,可以支持线性和非线性的分类。其主要思想为找到空间中的一个更够将所有数据样本划开的超平面,并且使得本本集中所有数据到这个超平面的距离最短。实际上有许多条直线(或超平面)可以将两类目标分开来,我们要找的其实是这些直线(或超平面)中分割两类目标时,有最大距离的直线(或超平面)。我们称这样的直线或超平面为最佳线性分类器。
本章将会介绍非线性可分支持向量机。
实验步骤
1 安装并导入所需要的库
!pip install numpy==1.16.0
!pip install pandas==0.25.0
!pip install scikit-learn==0.22.1
!pip install matplotlib==3.1.0

import numpy as np
import matplotlib.pyplot as plt
from sklearn import svm
%matplotlib inline

from mpl_toolkits.mplot3d import Axes3D
from sklearn.model_selection import GridSearchCV
2 创建数据集
在讨论非线性SVM细节之前,我们先自己创造一个非线性数据集,看一下效果,代码示例如下:
np.random.seed(0)
X_xor=np.random.randn(200,2)
y_xor=np.logical_xor(X_xor[:,0]>0,X_xor[:,1]>0)
y_xor=np.where(y_xor,1,-1)

plt.scatter(X_xor[y_xor==1,0],X_xor[y_xor==1,1],
              c='b',marker='x',label='1')
plt.scatter(X_xor[y_xor==-1,0],X_xor[y_xor==-1,1],
              c='r',marker='s',label='-1')
plt.ylim(-3.0)
plt.legend()
plt.show
3 核函数
显然,如果要用线性超平面将正负类分开是不可能的。而对于非线性的情况,SVM选择首先在低维空间中完成计算,然后通过核函数将输入空间映射到高维特征空间,并且这个高维度特征空间能够使得原来线性不可分数据变成了线性可分的,最终在高维特征空间中构造出最优分离超平面,从而把平面上本身不好分的非线性数据分开。令 () 表示将 x 映射后的特征向量,于是在特征空间中,划分超平面所对应的的模型可表示为:


几种常见的核函数
1 线性核:Linear Kernel
2 多项式核:Polynomial Kernel
3 高斯核:Gaussian Kernel
4 三维图来表示开头数据的维度
fig = plt.figure('3D scatter plot')
ax = Axes3D(fig)
ax.scatter(X_xor[y_xor==1,0]+6,X_xor[y_xor==1,1],
              c='b',marker='x',label='1',s=30,cmap='autumn')
ax.scatter(X_xor[y_xor==-1,0],X_xor[y_xor==-1,1],
              c='r',marker='s',label='-1',s=30,cmap='autumn')
ax.view_init(elev=30, azim=30)
5 sklearn实现SVM RBF分类
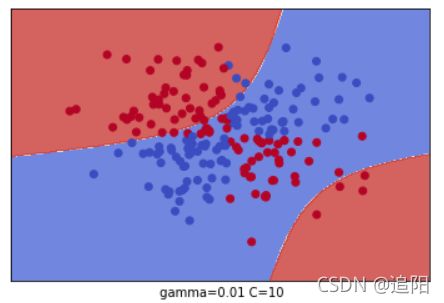
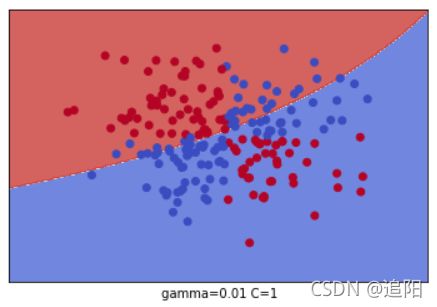
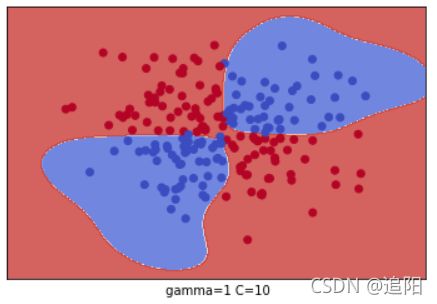
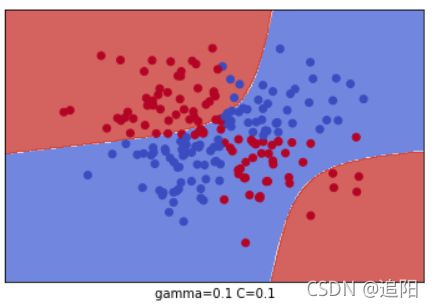
有了核函数的概念,我们就动手训练一个核SVM,看看是否能够对线性不可分数据集正确分类。分类时我们使用了网格搜索,在C=(0.1,1,10)和gamma=(1, 0.1, 0.01)形成的9种情况中选择最好的超参数,我们用了4折交叉验证。这里只是一个例子,实际运用中,你可能需要更多的参数组合来进行调参。
grid = GridSearchCV(svm.SVC(), param_grid={"C":[0.1, 1, 10], "gamma": [1, 0.1, 0.01]}, cv=4)
grid.fit(X_xor, y_xor)
print("The best parameters are %s with a score of %0.2f"
      % (grid.best_params_, grid.best_score_))
![]()
也就是说,通过网格搜索,在我们给定的9组超参数中,C=1, Gamma=1 分数最高,这就是我们最终的参数候选。
我们把这9种组合各个训练后,通过对网格里的点预测来标色,观察分类的效果图。代码如下:
x_min, x_max = X_xor[:, 0].min() - 1, X_xor[:, 0].max() + 1
y_min, y_max = X_xor[:, 1].min() - 1, X_xor[:, 1].max() + 1
xx, yy = np.meshgrid(np.arange(x_min, x_max,0.02),
                     np.arange(y_min, y_max, 0.02))

for i, C in enumerate((0.1, 1, 10)):
    for j, gamma in enumerate((1, 0.1, 0.01)):
        plt.subplot()
        clf = svm.SVC(C=C, gamma=gamma)
        clf.fit(X_xor,y_xor)
        Z = clf.predict(np.c_[xx.ravel(), yy.ravel()])

        # Put the result into a color plot
        Z = Z.reshape(xx.shape)
        plt.contourf(xx, yy, Z, cmap=plt.cm.coolwarm, alpha=0.8)

        # Plot also the training points
        plt.scatter(X_xor[:, 0], X_xor[:, 1], c=y_xor, cmap=plt.cm.coolwarm)

        plt.xlim(xx.min(), xx.max())
        plt.ylim(yy.min(), yy.max())
        plt.xticks(())
        plt.yticks(())
        plt.xlabel(" gamma=" + str(gamma) + " C=" + str(C))
        plt.show()


