深度学习基础 - 线性回归
线性回归-理论篇
-
- "回归"一词是怎么来的
- 解决什么样的问题
flyfish
本文包括了实现原理、Python版本的实现和C++版本的实现
TensorFlow实现线性回归(包括三个例子)
PyTorch实现线性回归(推荐的版本包括模型训练、保存、推理使用等)
PyTorch版本的线性回归源码下载地址
知识脉络
梯度下降 ⇔ 梯度⇔ 方向导数⇔偏导数⇔三角函数⇔余弦定理⇔勾股定理
"回归"一词是怎么来的
本文中描述的高中教科书是 人民教育出版社B版,高中教科书 《数学 选修 1-2》的第一章《“回归”一词的由来》22页
英国的统计学家弗朗西斯·高尔顿(Francis Galton,1822—1911)用统计方法研究两个变量之间关系。他研究父母身高与子女身高之间的关系,“回归”这个词由他引入的。
解决什么样的问题
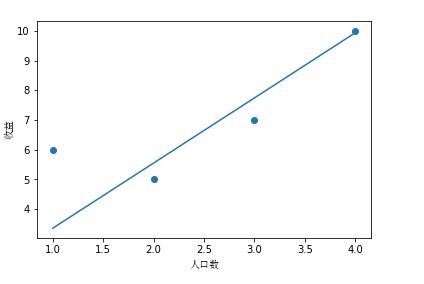
假设你是一个老板,想到其他城市再开一家分店,你拥有一份城市人口数对应收益的数据,问当一个城市有8 百万人,那么这家分店收益是多少?
数据如下
| 人口(百万) | 收益(亿元) |
|---|---|
| 1 | 6 |
| 2 | 5 |
| 3 | 7 |
| 4 | 10 |
回归公式
斜率 (图片来自wiki)
![]()
k = tan θ = y 2 − y 1 x 2 − x 1 = Δ y Δ x k = \tan \theta = \frac { y _ { 2 } - y _ { 1 } } { x _ { 2 } - x _ { 1 } } = \frac { \Delta y } { \Delta x } k=tanθ=x2−x1y2−y1=ΔxΔy
字母变更下
h θ ( x ) = θ 0 + θ 1 x h_\theta(x)=\theta_0+\theta_1x hθ(x)=θ0+θ1x
h 表示 hypothesis(假设),是一个函数,从x 到 y 的函数映射
m 表示样本数 对应例子中的4个样本
x 代表特征,输入变量,自变量 对应例子中的人口数
y 代表目标变量,输出变量,因变量 对应例子中的收益
整个步骤
1 预测函数(Hypothesis)
h θ ( x ) = θ 0 + θ 1 x h_{\theta}(x)=\theta_{0}+\theta_{1}x hθ(x)=θ0+θ1x
2 参数(Parameters)
θ 0 , θ 1 \theta_{0},\theta_{1} θ0,θ1
3 代价函数 (Cost Function),有的地方称为损失函数(Loss Function) 或者 误差函数(Error Function)
J ( θ 0 , θ 1 ) = 1 2 m ∑ i = 1 m ( h θ x ( i ) − y ( i ) ) 2 J(\theta_{0},\theta_{1}) = \frac{1}{2m}\sum_{i=1}^{m} (h_\theta x^{(i)}-y^{(i)})^2 J(θ0,θ1)=2m1i=1∑m(hθx(i)−y(i))2
4 目的(Goal)
( θ 0 , θ 1 ) = min θ 0 , θ 1 J ( θ 0 , θ 1 ) (\theta_{0},\theta_{1})=\min_{\theta_{0},\theta_{1}} J(\theta_{0},\theta_{1}) (θ0,θ1)=θ0,θ1minJ(θ0,θ1)
只有一个特征,这样的问题叫作单变量线性回归问题 或者一元线性回归问题
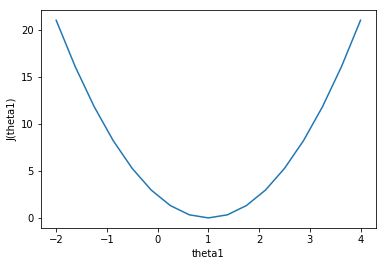
可视化理解 θ 0 = 0 \theta_0=0 θ0=0的情况
#假设有三组数据,数据分别为(1,1),(2,2),(3,3)
x=np.array([1,2,3])
y=np.array([1,2,3])
#预测1
y1=0.5*x
y2=1*x
y3=-0.5*x
print( (1/(2*len(x)) )* sum(np.power(y1-y,2))) #0.58
print( (1/(2*len(x)) )* sum(np.power(y2-y,2))) #0
print( (1/(2*len(x)) )* sum(np.power(y3-y,2))) #5.25

#画图 看看是J(theta1)什么样子的
#a=np.linspace(-2,2,9)#[-2.  -1.5 -1.  -0.5  0.   0.5  1.   1.5  2. ]
theta1=np.linspace(-2,4,17)
j=np.array([])
for i in theta1:
    y_=i*x
    b= (1/(2*len(x)) )* sum(np.power(y_-y,2))
    j=np.append(j,b)
print(j)

plt.xlabel('theta1')
plt.ylabel('J(theta1)')
plt.plot(theta1,j)

这个图像很像抛物线,高中 《数学 选修 2-1》59页抛物线
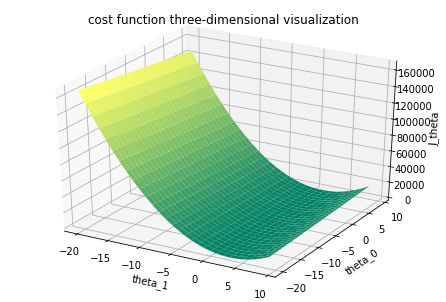
三维可视化
import numpy as np
import matplotlib.pyplot as plt
from mpl_toolkits.mplot3d import Axes3D

simple_count=30
x = np.arange(1,simple_count+1,1)
y = 2*x+1


k = np.arange(-20,simple_count-20,1)
b = np.arange(-20,simple_count-20,1)

theta_1,theta_0 = np.meshgrid(k, b)

J_theta = np.zeros([simple_count, simple_count])

for i in range(simple_count) :
    for j in range(simple_count) :
        J_theta[i][j]=((k[j]* x + b[i]-y)**2).sum()/simple_count


fig = plt.figure()
plt3d = Axes3D(fig)


plt.title("cost function three-dimensional visualization")
plt3d.set_xlabel("theta_1")
plt3d.set_ylabel("theta_0")
plt3d.set_zlabel("J_theta")
plt3d.plot_surface(theta_1, theta_0, J_theta, cmap=plt.cm.summer)

plt.show()

如果有多个特征,不仅仅是人口 x 1 x_1 x1,还包括,等级 x 2 x_2 x2,GDP x 3 x_3 x3等,这样的问题叫作多变量线性回归问题 或者多元线性回归问题
回归公式
h θ ( x ) = θ 0 + θ 1 x 1 + θ 2 x 2 + ⋯ + θ n x n = θ T x h_\theta(x)=\theta_0+\theta_1x_1+\theta_2x_2+\dots+\theta_nx_n=\theta^Tx hθ(x)=θ0+θ1x1+θ2x2+⋯+θnxn=θTx
公式的矩阵形式
θ T x = [ θ 1 θ 2 . . . θ n ] [ x 1 x 2 . . . x n ] = ∑ i = 1 n θ i x i = h θ ( x ) \theta^T x = \left[ \begin{matrix} \theta _ 1 \\\\ \theta _ 2 \\\\ ...\\\\ \theta _ n \\\\ \end{matrix} \right] \left[ \begin{matrix} x _ 1 & x _ 2 & ... & x _ n \end{matrix} \right] = \sum_{i=1}^n\theta _ i x _ i = h_\theta(x) θTx=⎣⎢⎢⎢⎢⎢⎢⎢⎢⎢⎢⎡θ1θ2...θn⎦⎥⎥⎥⎥⎥⎥⎥⎥⎥⎥⎤[x1x2...xn]=i=1∑nθixi=hθ(x)
上述公式中T的含义 行变列,列变行。
[ 1 , 2 3 , 4 5 , 6 ] T = [ 1 , 3 , 5 2 , 4 , 6 ] {\begin{bmatrix}1,2\\3,4\\5,6\end{bmatrix}}^{\mathrm {T} }={\begin{bmatrix}1,3,5\\2,4,6\end{bmatrix}} ⎣⎡1,23,45,6⎦⎤T=[1,3,52,4,6]
代价函数 (cost function)
J ( θ ) = 1 2 m ∑ i = 1 m ( h θ ( x ( i ) ) − y ( i ) ) 2 , m 为 样 本 数 J(\theta)=\frac{1}{2m}\sum\limits_{i=1}^{m}(h_\theta(x^{(i)})-y^{(i)})^2,\quad {m 为样本数} J(θ)=2m1i=1∑m(hθ(x(i))−y(i))2,m为样本数
矩阵形式
J ( θ ) = 1 2 m ( X θ − y ) T ( X θ − y ) J(\theta)=\frac{1}{2m}(X\theta-y)^T(X\theta-y) J(θ)=2m1(Xθ−y)T(Xθ−y)
梯度下降
教科书的内容不好理解,从简单的入手,为了易于理解我从勾股定理和三角函数开始说
三角函数 sin cos \sin \cos sincos
sin
sin A = opposite(对边) hypotenuse(斜边) \sin A = \frac { \text { opposite(对边) } } { \text { hypotenuse(斜边) } } sinA= hypotenuse(斜边) opposite(对边)
cos
cos A = adjacent(邻边) hypotenuse(斜边) \cos A = \frac { \text { adjacent(邻边) } } { \text { hypotenuse(斜边) } } cosA= hypotenuse(斜边) adjacent(邻边)
tan
tan A = sin A cos A \tan A = \frac { \sin A } { \cos A } tanA=cosAsinA
泰勒公式
《普林斯顿数学指南》第三卷中说 泰勒并不是第一个发现这个定理的人,尽管这个定理以他这个名字命名,但他是第一个领会到它的意义和应用它的人。
泰勒公式的思想是局部逼近,用多项式来近似表示一个复杂函数,就像有句话说的“如果我看过你看过的世界,走过你走过的路,是不是就能更靠近你一点”
用切线近似的表示一个弧
近似公式
f ( x ) ≈ f ( x 0 ) + f ′ ( x 0 ) ( x − x 0 ) f ( x ) \approx f \left( x _ { 0 } \right) + f ^ { \prime } \left( x _ { 0 } \right) \left( x - x _ { 0 } \right) f(x)≈f(x0)+f′(x0)(x−x0)
f ( x ) ≈ f ( x 0 ) + f ′ ( x 0 ) ( x − x 0 ) + a 2 ( x − x 0 ) 2 f ( x ) \approx f \left( x _ { 0 } \right) + f ^ { \prime } \left( x _ { 0 } \right) \left( x - x _ { 0 } \right) + a _ { 2 } \left( x - x _ { 0 } \right) ^ { 2 } f(x)≈f(x0)+f′(x0)(x−x0)+a2(x−x0)2
n次多项式近似的表示f(x)
P ( x ) = a 0 + a 1 ( x − x 0 ) + a 2 ( x − x 0 ) 2 + ⋯ + a n ( x − x 0 ) n P ( x ) = a _ { 0 } + a _ { 1 } \left( x - x _ { 0 } \right) + a _ { 2 } \left( x - x _ { 0 } \right) ^ { 2 } + \cdots + a _ { n } \left( x - x _ { 0 } \right) ^ { n } P(x)=a0+a1(x−x0)+a2(x−x0)2+⋯+an(x−x0)n
P n ( x ) = P ( x 0 ) + P ′ ( x 0 ) ( x − x 0 ) + P ′ ′ ( x 0 ) 2 ! ( x − x 0 ) 2 + ⋯ + P ( n ) ( x 0 ) n ! ( x − x 0 ) n \begin{aligned} P _ { n } ( x ) = & P \left( x _ { 0 } \right) + P ^ { \prime } \left( x _ { 0 } \right) \left( x - x _ { 0 } \right) + \frac { P ^ { \prime \prime } \left( x _ { 0 } \right) } { 2 ! } \left( x - x _ { 0 } \right) ^ { 2 } + \cdots + \frac { P ^ { ( n ) } \left( x _ { 0 } \right) } { n ! } \left( x - x _ { 0 } \right) ^ { n } \end{aligned} Pn(x)=P(x0)+P′(x0)(x−x0)+2!P′′(x0)(x−x0)2+⋯+n!P(n)(x0)(x−x0)n
算法
θ j : = θ j − α ∂ ∂ θ j J ( θ ) α 是 学 习 率 \theta_j := \theta_j-\alpha\frac{\partial}{\partial\theta_j}J(\theta) \quad {\alpha 是学习率} θj:=θj−α∂θj∂J(θ)α是学习率
r e p e a t u n t i l c o n v e r g e n c e { θ j : = θ j − α ∂ ∂ θ j J ( θ 0 , θ 1 ) } \begin{aligned} & repeat\ until\ convergence \{ \\ & \theta _ { j } : = \theta _ { j } - \alpha \frac { \partial } { \partial \theta _ { j } } J \left( \theta _ { 0 } , \theta _ { 1 } \right) \\ &\}\\ \end{aligned} repeat until convergence{θj:=θj−α∂θj∂J(θ0,θ1)}
求代价函数的导数
∂ ∂ θ j J ( θ 0 θ 1 ) = ∂ ∂ θ j 1 2 m ∑ i = 1 m ( h θ ( x ( i ) ) − y ( i ) ) 2 \frac { \partial } { \partial \theta _ { j } } J \left( \theta _ { 0 } \theta _ { 1 } \right) = \frac { \partial } { \partial \theta _ { j } } \frac { 1 } { 2 m } \sum _ { i = 1 } ^ { m } \left( h _ { \theta } \left( x ^ { ( i ) } \right) - y ^ { ( i ) } \right) ^ { 2 } ∂θj∂J(θ0θ1)=∂θj∂2m1i=1∑m(hθ(x(i))−y(i))2
j=0
∂ ∂ θ 0 J ( θ 0 θ 1 ) = 1 m ∑ i = 1 m ( h θ ( x ( i ) ) − y ( i ) ) \frac { \partial } { \partial \theta _ { 0 } } J \left( \theta _ { 0 } \theta _ { 1 } \right) = \frac { 1 } { m } \sum _ { i = 1 } ^ { m } \left( h _ { \theta } \left( x ^ { ( i ) } \right) - y ^ { ( i ) } \right) ∂θ0∂J(θ0θ1)=m1i=1∑m(hθ(x(i))−y(i))
j=1
∂ ∂ θ 1 J ( θ 0 θ 1 ) = 1 m ∑ i = 1 m ( ( h θ ( x ( i ) ) − y ( i ) ) ⋅ x ( i ) ) \frac { \partial } { \partial \theta _ { 1 } } J \left( \theta _ { 0 } \theta _ { 1 } \right) = \frac { 1 } { m } \sum _ { i = 1 } ^ { m } \left( \left( h _ { \theta } \left( x ^ { ( i ) } \right) - y ^ { ( i ) } \right) \cdot x ^ { ( i ) } \right) ∂θ1∂J(θ0θ1)=m1i=1∑m((hθ(x(i))−y(i))⋅x(i))
r e p e a t { θ 0 : = θ 0 − α 1 m ∑ i = 1 m ( h θ ( x ( i ) ) − y ( i ) ) θ 1 : = θ 1 − α 1 m ∑ i = 1 m ( ( h θ ( x ( i ) ) − y ( i ) ⋅ x ( i ) ) } \begin{aligned} repeat \ \{\\ &\theta _ { 0 } : = \theta _ { 0 } - \alpha \frac { 1 } { \mathrm { m } } \sum _ { \mathrm { i } = 1 } ^ { \mathrm { m } } \left( \mathrm { h } _ { \theta } \left( \mathrm { x } ^ { ( \mathrm { i } ) } \right) - \mathrm { y } ^ { ( \mathrm { i } ) } \right) \ \ \\ &\theta _ { 1 } : = \theta _ { 1 } - \alpha \frac { 1 } { \mathrm { m } } \sum _ { \mathrm { i } = 1 } ^ { \mathrm { m } } \left( \left( \mathrm { h } _ { \theta } \left( \mathrm { x } ^ { ( \mathrm { i } ) } \right) - \mathrm { y } ^ { ( \mathrm { i } ) } \cdot \mathrm { x } ^ { ( \mathrm { i } ) } \right)\right. &\ \\\} \end{aligned} repeat {}θ0:=θ0−αm1i=1∑m(hθ(x(i))−y(i)) θ1:=θ1−αm1i=1∑m((hθ(x(i))−y(i)⋅x(i))
代码
import matplotlib.pyplot as plt
import numpy as np
import matplotlib
zhfont = matplotlib.font_manager.FontProperties(fname='C:\Windows\Fonts\simsun.ttc')


#theta0需要和1相乘,所以加了一列1
def getDataSet():
    dataset_x = np.array([[1,1,1,1],[1,2,3,4]]).T
    y = np.array([[6],[5],[7],[10]])
    print(dataset_x)
    print(y)
    return dataset_x,y


def getCost(dataset_x, y ,theta):
    temp = np.power((dataset_x*theta.T) - y,2)
    return 1/(2*len(dataset_x)*sum(temp))


    '''
    theta: 需要更新的theta值
    alpha: 学习速率
    iters:迭代次数
    '''
def gradientDescent(dataset_x, y ,theta, alpha, iters):

    temp = np.mat(np.zeros(theta.shape))
    cost = np.zeros(iters)
    parameters = int (theta.shape[1])

    for  i in range(iters):
        error = dataset_x*theta.T - y
        for j in range(parameters):
            term = np.multiply(error,dataset_x[:,j])
            temp[0,j] = theta[0,j] - alpha / len(dataset_x) * sum(term)
        theta = temp
        cost[i] = getCost(dataset_x,y,theta)
    return  theta,cost


if __name__ == '__main__':
    dataset_x,y = getDataSet()
    alpha = 0.01
    theta = np.mat(np.array([0,0]))
    print(theta)
    dataset_x = np.mat(dataset_x)
    y = np.mat(y)
    print(dataset_x)
    print(y)
    iters = 100
    theta,cost = gradientDescent(dataset_x,y,theta,alpha,iters)
    x = np.linspace(dataset_x[:,1].min(),dataset_x[:,1].max(),100)
    h = theta[0,0] + (theta[0,1] * x)


    plt.scatter(np.array(dataset_x[:,1]),np.array(y[:,0]))
    plt.xlabel('人口数',fontproperties=zhfont)
    plt.ylabel('收益',fontproperties=zhfont)
    plt.plot(x,h)

L1-norm(LASSO回归)
J ( θ ) = 1 2 ∑ i = 1 m ( h θ ( x i ) − y ( i ) ) 2 + λ ∑ j = 1 n ∣ θ j ∣ λ > 0 J(\theta) = \frac{1}{2}\sum^m_{i=1}(h_{\theta}(x^{i}) - y^{(i)})^2 + \lambda\sum^n_{j=1} |\theta_j| \ \ \ \lambda > 0 J(θ)=21i=1∑m(hθ(xi)−y(i))2+λj=1∑n∣θj∣ λ>0
L2-norm(Ridge回归,岭回归)
J ( θ ) = 1 2 ∑ i = 1 m ( h θ ( x i ) − y ( i ) ) 2 + λ ∑ j = 1 n θ j 2 λ > 0 J(\theta) = \frac{1}{2}\sum^m_{i=1}(h_{\theta}(x^{i}) - y^{(i)})^2 + \lambda\sum^n_{j=1} \theta_j^2 \ \ \ \lambda > 0 J(θ)=21i=1∑m(hθ(xi)−y(i))2+λj=1∑nθj2 λ>0
同时引入L1-norm和L2-norm(弹性网络ElasitcNet)
J ( θ ) = 1 2 ∑ i = 1 m ( h θ ( x i − y ( i ) ) ) 2 + λ ( p ∑ j = 1 n θ j 2 + ( 1 − p ) ∑ j = 1 n ∣ θ j ∣ ) λ > 0 & & p ∈ [ 0 , 1 ] J(\theta) = \frac{1}{2}\sum^m_{i=1}(h_{\theta}(x^{i} - y^{(i)}))^2 + \lambda(p\sum^n_{j=1} \theta_j^2 +(1-p)\sum^n_{j=1} |\theta_j| )\ \ \ \lambda > 0 \&\& p \in [0,1] J(θ)=21i=1∑m(hθ(xi−y(i)))2+λ(pj=1∑nθj2+(1−p)j=1∑n∣θj∣) λ>0&&p∈[0,1]
C++ 实现
#include
#include
#include
#include
#include


class VectorAssist
{
public:

	static std::vector diff(std::vector* predictions, std::vector* y)
	{
		std::vector diff(predictions->size(), 0);;
		std::transform(predictions->begin(), predictions->end(), y->begin(), diff.begin(), std::minus());
		return diff;
	}

	static std::vector multiplication(std::vector* diff, std::vector* x)
	{
		std::vector differror(diff->size(), 0);;
		std::transform(diff->begin(), diff->end(), x->begin(), differror.begin(), std::multiplies());
		return differror;
	}

	static double sum(std::vector* error)
	{
		return std::accumulate(error->begin(), error->end(), 0.0);
	}

	static std::vector square(std::vector* error)
	{
		std::vector square_errors;

		std::for_each(error->begin(), error->end(), [&square_errors](double i) {
			square_errors.push_back(std::pow(static_cast(i), 2)); });
		return square_errors;
	}
};

class LinearRegression
{
public:
	std::vector* x_;
	std::vector* y_;
	int sample_count_;

	double *theta_;
public:
	LinearRegression(std::vector* x, std::vector* y)
	{
		this->x_ = x;
		this->y_ = y;
		sample_count_ = x->size();
	}

	//梯度下降
	double *gradient_descent(double alpha, int iters, double *J)
	{

		double *theta = new double[2];
		theta[0] = 1;
		theta[1] = 1;
		for (int i = 0; i < iters; i++)
		{
			std::vector predictions = calculate_predictions(x_, theta);
			std::vector diff = VectorAssist::diff(&predictions, y_);
			std::vector error_x1 = diff;
			std::vector error_x2 = VectorAssist::multiplication(&diff, x_);
			theta[0] = theta[0] - alpha * (1.0 / sample_count_) * VectorAssist::sum(&error_x1);
			theta[1] = theta[1] - alpha * (1.0 / sample_count_) * VectorAssist::sum(&error_x2);
			J[i] = compute_cost(x_, y_, theta);
		}
		return theta;
	}

	// 训练
	void train(double alpha, int iterations)
	{
		double *J = new double[iterations];
		this->theta_ = gradient_descent(alpha, iterations, J);
		std::cout << "Theta: " << theta_[0] << ", " << theta_[1] << std::endl;
	}

	//预测
	double predict(double x)
	{
		return h(x, theta_);
	}

	//代价函数 (Cost Function)
	double compute_cost(std::vector* x, std::vector* y, double theta[])
	{
		std::vector predictions = calculate_predictions(x, theta);
		std::vector diff = VectorAssist::diff(&predictions, y);
		std::vector  square_errors  = VectorAssist::square(&diff);
		return (1.0 / (2 * sample_count_)) * VectorAssist::sum(&square_errors );
	}

	//预测
	double h(double x, double theta[])
	{
		return theta[0] + theta[1] * x;
	}


	std::vector calculate_predictions(std::vector* x, double theta[])
	{
		std::vector predictions;
		for (int i = 0; i < sample_count_; i++)
		{
			predictions.push_back(h(x->at(i), theta));
		}
		return predictions;
	}
};


int main()
{
	std::cout << "Hello World!\n";
	double alpha = 0.01;
	int iterations = 20;
	double x_predict = 6;
	double y_predict;

	std::vector X;
	std::vector Y;
	for (int i = 0; i < 10; i++)
	{
		X.push_back(i);
		Y.push_back(i * 2 + 1);
	}

	LinearRegression lr(&X, &Y);
	lr.train(alpha, iterations);
	y_predict = lr.predict(x_predict);
	std::cout << y_predict << std::endl;

	system("pause");
}