我用 Python 爬取4000多条笔记本电脑的销售数据并分析
2022年,大部分电子产品的销量都在下滑,比如手机,一方面,产品的创新和提升不足,另一方面,大部分人更愿意把钱存起来,降低生活中其他因素带来的风险。至于手机、笔记本电脑这些电子产品,只要能用,大部分人都不会选择换新。
本文爬取了4000多条某宝的笔记本电脑销售数据,分析当前笔记本的整体价格情况。
文章目录
-
- 数据获取
- 技术提升
- 数据分析
-
- 1.笔记本电脑的价格分布
- 2.笔记本电脑的购买人数分布
- 3.购买人数超过500的价格分布
- 4.购买人数超过500的价格Top20
- 5.销售标题信息提取
- 总结
数据获取
先进入某宝首页,在搜索框输入关键词“笔记本电脑”,然后拖动滚动条到下方翻页处,点击几次“下一页”和“上一页”,把每个页面的url复制出来进行对比,观察url的变化。发现每次变化的参数都是页面相关的参数s,所以代码中改变s参数就可以依次获取每个页面的数据。
核心的代码如下,受篇幅限制,完整代码获取方式
技术提升
文章源码、数据、面试技术提升,可以加入我们,目前开通了面试技术交流群,群友已超过2000人,添加时最好的备注方式为:来源+兴趣方向,方便找到志同道合的朋友
方式1、添加微信号:dkl88191,备注:来自CSDN+ 笔记本电脑
方式2、微信搜索公众号:Python学习与数据挖掘,后台回复:笔记本电脑
def get_taobao_data():
    df_data = pd.DataFrame()
    for p in range(PAGE):
        try:
            print("-----开始获取第{}页数据-------".format(p+1))
            url = 'https://s.taobao.com/search?q={}&s={}'.format(GOODS, 44*p)
            res = requests.get(url, headers=headers, timeout=30)
            print("---------获取第{}页数据成功---{}".format(p+1, res.status_code))
            df_res = data_parse(res.text)
            df_data = pd.concat([df_data, df_res])
        except Exception as e:
            time.sleep(10)
            print("---------获取第{}页数据失败---{}".format(p+1, e))
            continue
        time.sleep(10)
    df_data.to_excel('taobao_data_{}.xlsx'.format(GOODS))


if __name__ == '__main__':
    get_taobao_data()
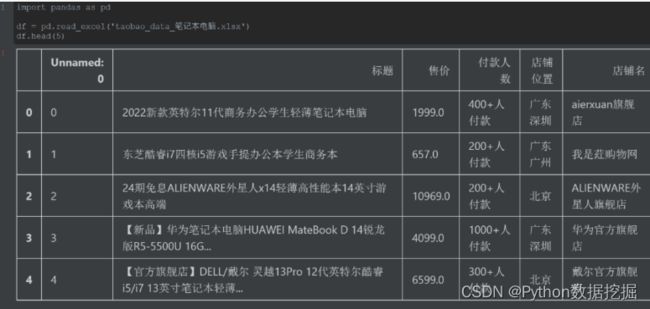
本文获取了前100页数据,共4044条。
初步检查了数据,这份数据是很完整的,没有缺失值,只是其中的“付款人数”是数字加文字的字符串,可以先清洗成只有数字,也可以后面可视化时再解析。因为处理不复杂,所以本文等取数时再处理。
数据分析
本文的分析和可视化主要围绕“价格”和“购买人数”这两个特征,拿到数据后,你可以根据自己关注的点做更多的分析。
1.笔记本电脑的价格分布
def computer_price():
    """笔记本电脑的价格分布"""
    df = pd.read_excel('taobao_data_笔记本电脑.xlsx')
    price = df['售价']
    sections = [0, 2500, 5000, 7500, 10000, 12500, 15000, 100000]
    group_names = ['2500以下', '2500-5000', '5000-7500', '7500-10000', '10000-12500', '12500-15000', '15000以上']
    cuts = pd.cut(np.array(price), sections, labels=group_names)
    price_counts = pd.value_counts(cuts)
    pie = Pie(init_opts=opts.InitOpts(width='800px', height='600px', bg_color='white'))
    pie.add(
        '', [list(z) for z in zip([gen for gen in price_counts.index], price_counts)],
        radius=['0', '60%'], center=['50%', '50%'],
        itemstyle_opts=opts.ItemStyleOpts(border_width=2, border_color='white'),
    ).set_series_opts(
        label_opts=opts.LabelOpts(formatter="{d}%", position='top'),
    ).set_global_opts(
        title_opts=opts.TitleOpts(title='笔记本电脑价格区间分布', pos_left='300', pos_top='40',
            title_textstyle_opts=opts.TextStyleOpts(color='blue', font_size=20)),
        legend_opts=opts.LegendOpts(pos_right=20, pos_top=250, orient='vertical')
    ).set_colors(
        ['rgba(0, 0, 255, {a})'.format(a=0.9-0.1*x) for x in range(len(group_names))]
    ).render('computer_price_counts.html')
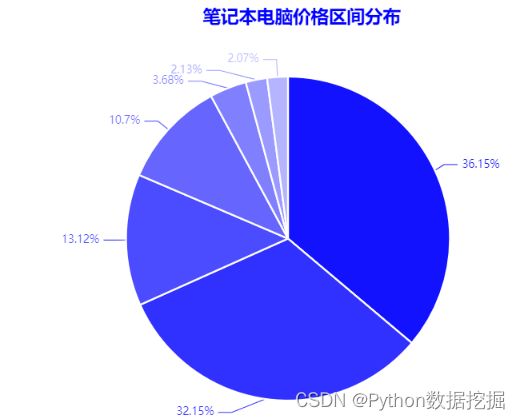
只看价格,分布最多的两个价格区间是2500-5000和5000-7500,超过1W的笔记本电脑加起来也不到8%。
2.笔记本电脑的购买人数分布
def computer_sales_num():
    """笔记本电脑的购买人数"""
    df = pd.read_excel('taobao_data_笔记本电脑.xlsx')
    sales_num = df['付款人数'].apply(lambda x: int(re.findall(r'\d+', x)[0]))
    sections = [-1, 49, 99, 199, 499, 999, 100000]
    group_names = ['50以下', '50-100', '100-200', '200-500', '500-1000', '1000以上']
    cuts = pd.cut(np.array(sales_num), sections, labels=group_names)
    sales_num_counts = pd.value_counts(cuts)
    pie = Pie(init_opts=opts.InitOpts(width='800px', height='600px', bg_color='white'))
    pie.add(
        '', [list(z) for z in zip([gen for gen in sales_num_counts.index], sales_num_counts)],
        radius=['30%', '60%'], center=['50%', '50%'],
        itemstyle_opts=opts.ItemStyleOpts(border_width=2, border_color='white'),
    ).set_series_opts(
        label_opts=opts.LabelOpts(formatter="{c}", position='top'),
    ).set_global_opts(
        title_opts=opts.TitleOpts(title='笔记本电脑购买人数分布', pos_left='300', pos_top='40',
            title_textstyle_opts=opts.TextStyleOpts(color='rgba(60, 120, 60)', font_size=20)),
        legend_opts=opts.LegendOpts(pos_right=30, pos_top=250, orient='vertical')
    ).set_colors(
        ['rgba(60, 120, 60, {a})'.format(a=0.9-0.1*x) for x in range(len(group_names))]
    ).render('computer_sales_num_counts.html')
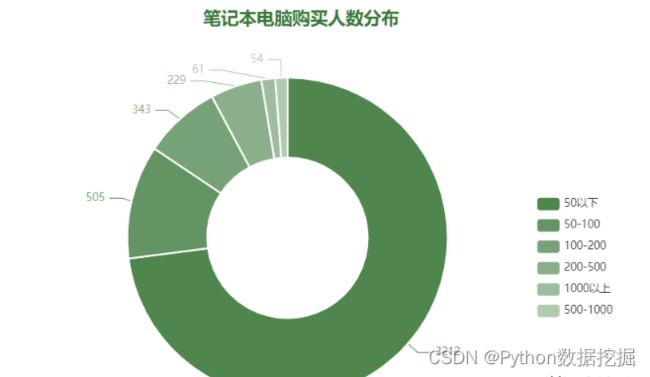
再从购买人数看,超过7成的电脑成交量在50台以下,同一家店铺同一款电脑能卖出500台以上的非常少。
3.购买人数超过500的价格分布
def computer_sales500_price():
    """购买人数超过500的笔记本电脑价格分布"""
    df = pd.read_excel('taobao_data_笔记本电脑.xlsx')
    df['人数'] = df['付款人数'].apply(lambda x: int(re.findall(r'\d+', x)[0]))
    sales500_price = df.loc[df['人数'] >= 500, '售价']
    sections = [0, 2500, 5000, 7500, 10000, 100000]
    group_names = ['2500以下', '2500-5000', '5000-7500', '7500-10000', '10000以上']
    cuts = pd.cut(np.array(sales500_price), sections, labels=group_names)
    price_counts = pd.value_counts(cuts)
    pie = Pie(init_opts=opts.InitOpts(width='800px', height='600px', bg_color='white'))
    pie.add(
        '', [list(z) for z in zip([gen for gen in price_counts.index], price_counts)],
        radius=['0', '60%'], center=['50%', '50%'],
        itemstyle_opts=opts.ItemStyleOpts(border_width=2, border_color='white'),
    ).set_series_opts(
        label_opts=opts.LabelOpts(formatter="{c}款:{d}%", position='top'),
    ).set_global_opts(
        title_opts=opts.TitleOpts(title='购买人数500以上的笔记本电脑价格分布', pos_left='250', pos_top='40',
            title_textstyle_opts=opts.TextStyleOpts(color='blue', font_size=20)),
        legend_opts=opts.LegendOpts(pos_right=10, pos_top=250, orient='vertical')
    ).set_colors(
        ['rgba(0, 0, 255, {a})'.format(a=0.9-0.1*x) for x in range(len(group_names))]
    ).render('computer_sales500_price_counts.html')
同时看价格和购买人数两个特征,根据单款购买人数超过500的笔记本电脑价格分布,分布最多的区间是5000-7500和2500-5000。
与不考虑购买人数时对比,5000-7500区间的占比提高了近10%,说明这个价格区间的购买人数最多。
4.购买人数超过500的价格Top20
def computer_sales500_price_Top20():
    """购买人数超过500的笔记本电脑价格Top20"""
    df = pd.read_excel('taobao_data_笔记本电脑.xlsx')
    df['人数'] = df['付款人数'].apply(lambda x: int(re.findall(r'\d+', x)[0]))
    sales500_price = df.loc[df['人数'] >= 500, '售价']
    sales500_price_top20 = sales500_price.sort_values(ascending=False)[0: 20]
    sales500_price_top20_shop = df.loc[sales500_price_top20.index, '店铺名']
    bar = Bar(init_opts=opts.InitOpts(width='1000px', height='400px', bg_color='white'))
    bar.add_xaxis(
        sales500_price_top20_shop.to_list()
    ).add_yaxis(
        '', sales500_price_top20.to_list(), category_gap=20
    ).set_global_opts(
        title_opts=opts.TitleOpts(title='购买人数超过500的笔记本电单价Top20', pos_left='350', pos_top='30',
            title_textstyle_opts=opts.TextStyleOpts(color='#4863C4', font_size=16)),
        xaxis_opts=opts.AxisOpts(axislabel_opts=opts.LabelOpts(font_size=10, rotate=25, color='#4863C4'))
    ).set_colors('#4863C4').render('computer_sales500_price_top20.html')
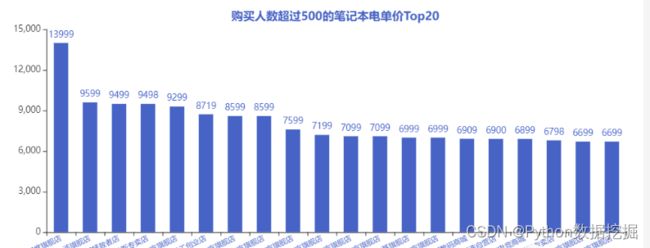
把购买人数超过500的单价Top20展示出来,发现仅有一款单价超过1W的。如果看店铺的名字,某品牌占了“半壁江山”。
5.销售标题信息提取
def computer_title_word_cloud():
    """笔记本电脑的标题词云"""
    df = pd.read_excel('taobao_data_笔记本电脑.xlsx')
    title_content = df['标题']
    all_word = ','.join([str(t) for t in title_content])
    cut_text = jieba.cut(all_word)
    result = ' '.join(cut_text)
    pic = Image.open("computer.png")
    shape = np.array(pic)
    exclude = {'代'}
    image_colors = ImageColorGenerator(shape)
    wc = WordCloud(font_path="simhei.ttf", width=800, height=600, max_words=800, max_font_size=80, min_font_size=5,
                   background_color='white', color_func=image_colors,
                   contour_width=3, contour_color='steelblue', stopwords=exclude,
                   prefer_horizontal=1, mask=shape, relative_scaling=0.5)
    wc.generate(result)
    wc.to_file("ciyun_computer_title.png")
现在的店铺标题普遍都起得很长,主要目的是为了包含更多的关键词,提高被搜索到的几率,所以本文将标题的信息制作成词云。
从结果来看,主要信息里的关键词都是与笔记本电脑强相关的,如英特尔、i5、i7等主要与性能相关,游戏本、办公、商务等主要与功能定位相关,轻薄、便携、全面屏等主要与电脑的特点相关。
总结
本文主要分为两个部分,一个部分是用爬虫获取某宝的数据,一个部分是用Python进行简单分析和可视化。
本文的内容仅供学习和练习Python相关知识使用和参考,勿作他用。
