机器学习算法——混淆矩阵(Confusion Matrix)之鸢尾花实例
一、理论
什么是混淆矩阵?其实就是把所有类别的预测结果与真实结果按类别放置到了同一个表里,在这个表里我们可以清楚地看到每个类别正确识别的数量和错误识别的数量。
混淆矩阵在什么情况下最好呢?答案是类别不平衡时。
混淆矩阵是除了ROC曲线和AUC之外的另一个判别分类好坏程度的方法。
TP=True Positive=真阳性(真实为0,预测为0,即将正类预测为正类)
FP=False Positive=假阳性(真实为1,预测为0,即将负类预测为正类)
FN=False Negative=假阴性(真实为0,预测为1,即将正类预测为负类)
TN=True Negative=真阴性(真实为1,预测为1,即将负类预测为负类)
针对二分类来说,混淆矩阵为
| 预测值=0 | 预测值=1 | |
| 真实值=0 | TN | FP |
| 真实值=1 | FN | TP |
即,矩阵的每一列表示的是模型预测的样本情况,矩阵的每一行表示的样本的真实情况。
准确率ACC(在所有样本中,预测正确的样本所占的比例):
![]()
精确率PPV(也叫“查准率”,在所有预测为正例的样本中,预测正确为正例所占的比例):
错误发现率FDR(所有预测为正例的样本中,预测错误所占的比例):
错误遗漏率FOR(在所有预测为负类的样本中,真正为正类所占的比例。)
阴性预测值NPV(在所有预测为负类的样本中,真正为负类所占的比例)
召回率Recall(又叫“查全率”,在所有实际为正例的样本中,预测正确所占的比例):
![]()
假正率FPR(在模型预测为正类的样本中,占模型负类样本数量的比值):
![]()
假负类率FNR(在模型预测为负类的样本中,占模型正类样本数量的比值):
真负类率TNR(在模型为负类的样本中,占模型负类样本数量的比值):
F1-Score(F1-score就是精确率和召回率的调和平均值,F1-score值认为精确率和召回率一样重要,其取值范围从0到1,0代表模型的输出结果最好,0代表模型的输出结果最差。)
二、代码:
首先导入需要的库:
from sklearn.datasets import load_iris
from sklearn.svm import SVC
from sklearn.model_selection import train_test_split
import numpy as np
import matplotlib.pyplot as plt
from sklearn.metrics import confusion_matrix
from sklearn.metrics import accuracy_score
from sklearn.metrics import recall_score
使用SVM对鸢尾花进行预测,核函数选用线性核函数,具体代码为:
if  __name__ == '__main__':
    #导入鸢尾花数据集
    data = load_iris()
    X = data.data
    y = data.target
    print(y)
    # 查看鸢尾花数据集的特征名称,为‘萼片长度(厘米)’‘萼片宽度(厘米)’‘花瓣长度(厘米)’‘花瓣宽度(厘米)’”
    feature_names = data.feature_names
    print(X.shape) #(150,4)一共150条数据
    no_repeat = np.unique(y) #得到【0 1 2】三分类问题,包括山鸢尾花、变色鸢尾花和维吉尼亚鸢尾花
    Xtrain, Xtest, Ytrain, Ytest = train_test_split(X, y, test_size=0.3, random_state=420)  # 划分训练集和测试集

    clf = SVC(kernel="linear"
                      , gamma="auto"
                      , #degree=1 #多项式核函数,1就是线性,3就是非线性
                      cache_size=5000#允许使用电脑的多少内存来进行计算,单位是MB,默认200MB
                      ).fit(Xtrain, Ytrain)

    pre_train = clf.predict(Xtrain)
    pre_test = clf.predict(Xtest)

    print("train:", accuracy_score(Ytrain, pre_train))
    print("test:", accuracy_score(Ytest, pre_test))
    #如果是二分类问题,averga可省略
    print("recall(micro):", recall_score(Ytest, pre_test,average="micro"))#对数据集中的每一个实例不分类别进行统计建立全局混淆矩阵,然后计算相应指标
    print("recall(macro):", recall_score(Ytest, pre_test, average="macro"))#先对每一个类统计指标值,然后对所有类求算数平均值
    print("recall(micro):", recall_score(Ytest, pre_test, average="weighted"))#计算每个实例的标签,并找到他们的平均加权长度

    #混淆矩阵
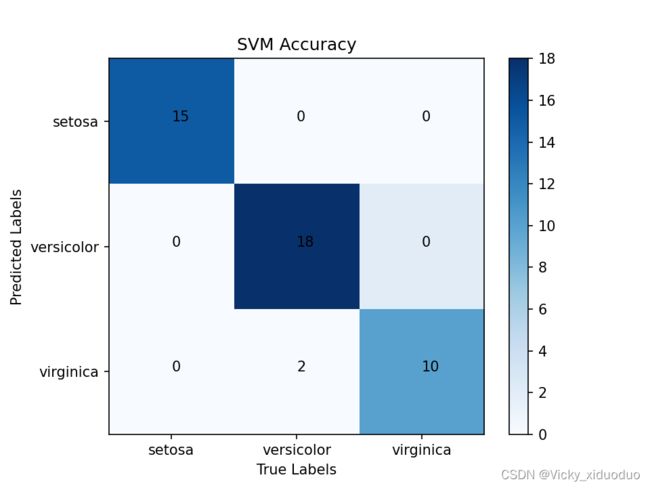
    confusion = confusion_matrix(Ytest, pre_test)

    #热度图
    plt.imshow(confusion, cmap=plt.cm.Blues)

    indices = range(len(confusion))

    plt.xticks(indices, ['setosa', 'versicolor', 'virginica'])
    plt.yticks(indices, ['setosa', 'versicolor', 'virginica'])

    plt.colorbar()

    plt.xlabel("True Labels")

    plt.ylabel("Predicted Labels")

    plt.title("SVM Accuracy")

    for first_index in range(len(confusion)):
        for second_index in range(len(confusion)):
            plt.text(first_index, second_index, confusion[first_index][second_index])

    plt.show()
得到的混淆矩阵可视化图为:
召回率的结果为:

