一些常用python生成
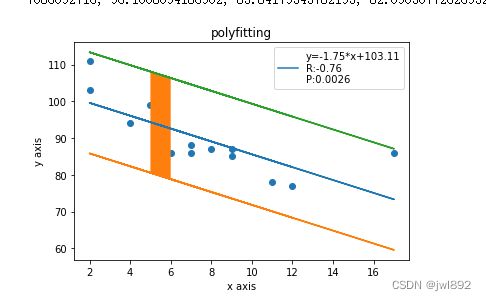
1.创建散点图,包括置信区间
import pandas as pd
from scipy import stats
import matplotlib.pyplot as plt
import numpy as np


x = [5,7,8,7,2,17,2,9,4,11,12,9,6]
y = [99,86,87,88,111,86,103,87,94,78,77,85,86]

slope, intercept, r, p, std_err = stats.linregress(x, y)
print(slope, intercept, r, p, std_err)
def myfunc(x):
  return slope * x + intercept
mymodel = list(map(myfunc, x))

#y=slope * x + intercept
regression_equation="y="+"{:.2f}".format(slope)+"*x+"+"{:.2f}".format(intercept)+"\nR:"+"{:.2f}".format(r)+"\nP:"+"{:.4f}".format(p)

y_pred= mymodel
print(y_pred)
std=np.std(y_pred)
# y_pred, std = model.predict(x, return_std=True)

std_z = 1.96 # from z-table for 95%
confidence_interval = std * std_z

plt.scatter(x, y)
plt.plot(x, mymodel,label=regression_equation)
plt.plot(x, y_pred - confidence_interval)
plt.plot(x, y_pred + confidence_interval)

plt.fill_between(x, y_pred - confidence_interval, y_pred + confidence_interval)
plt.xlabel('x axis')
plt.ylabel('y axis')
plt.legend(loc="best") # 指定legend的位置,读者可以自己help它的用法
plt.title('polyfitting')
plt.show()
#导入线多项式拟合工具:
import numpy as np
import matplotlib.pyplot as plt
from numpy import polyfit, poly1d

x = np.linspace(-5, 5, 100)
y = 4 * x + 1.5
noise_y = y + np.random.randn(y.shape[-1]) * 2.5

coeff = polyfit(x, noise_y, 1)

p = plt.plot(x, noise_y, 'rx')
p = plt.plot(x, coeff[0] * x + coeff[1], 'k-')
p = plt.plot(x, y, 'b--')

#还可以用 poly1d 生成一个以传入的 coeff 为参数的多项式函数:
#f = poly1d(coeff)
#p = plt.plot(x, noise_y, 'rx')
#p = plt.plot(x, f(x))
2.高斯分布基本概念及Python生成高斯分布数据集
https://gemini-yang.blog.csdn.net/article/details/96283330
from sklearn import datasets
from sklearn.datasets import make_blobs
import numpy as np
import matplotlib.pyplot as plt
import itertools
n_samples = 2000

for i in range(1):
    random_state = i

    X_varied, y_varied = make_blobs(n_samples = n_samples,
                                    centers = [[-2, 0], [-12, 5],
                                               [6, 5], [-5, 7],
                                               [8, -10], [-10, -12]],
                                    cluster_std=[2, 2, 1.5, 1, 3, 3.5],
                                    random_state=random_state)
    plt.scatter(X_varied[:, 0], X_varied[:, 1], c = y_varied)
    plt.show()
#n_samples是待生成的样本的总数。n_features是每个样本的特征数。centers表示类别数
#cluster_std表示每个类别的方差,random_state是随机数种子
3.矩阵拼接
常用:
#hstack()在行上合并

np.hstack((a,b))

#vstack()在列上合并

np.vstack((a,b))

以上a,b分别为两个numpy矩阵。hstack在行上合并,vstack在列上合并。
将相同shape的矩阵放在列表中,然后将列表转化为矩阵。
a
Out[29]:
array([[9, 1, 5],
       [5, 6, 5]])
------------------------------------------------
b
Out[30]:
array([[1, 4, 1],
       [3, 5, 9]])
------------------------------------------------
c = []
c.append(a)
c.append(b)
------------------------------------------------
c
Out[34]:
[array([[9, 1, 5],
        [5, 6, 5]]), array([[1, 4, 1],
        [3, 5, 9]])]
------------------------------------------------
d = np.array(c)
------------------------------------------------
d
Out[36]:
array([[[9, 1, 5],
        [5, 6, 5]],
       [[1, 4, 1],
        [3, 5, 9]]])
------------------------------------------------
a.shape
Out[37]: (2, 3)
------------------------------------------------
b.shape
Out[38]: (2, 3)
------------------------------------------------
d.shape
Out[39]: (2, 2, 3)
np.concatenate的使用
将append完相同shape矩阵的列表进行np.concatenate操作,相当于把矩阵按行进行拼接。比如在cifar-10中,将5个训练数据拼接。
示例代码如下:
import numpy as np
a = np.random.randint(1, 10, (2, 3))
b = np.random.randint(1, 10, (2, 3))
-------------------------------------------------------
a
Out[5]:
array([[6, 9, 1],
       [2, 8, 1]])
-------------------------------------------------------
b
Out[6]:
array([[4, 3, 9],
       [4, 5, 2]])
-------------------------------------------------------
c = []
c.append(a)
c.append(b)
-------------------------------------------------------
d = np.concatenate(c)
-------------------------------------------------------
d.shape
Out[11]: (4, 3)
