机器学习3—分类算法之支持向量机(Support Vector Machine,SVM)算法
SVM算法
- 一、算法思想
-
-
- 1.1svm.SVC()方法的使用
- 1.2SVC方法主要步骤
- 1.3SVC简单使用例题
-
- 二、用SVM分析红酒数据
- 三、SVM分析红酒数据集的进一步优化
-
-
- 3.1代码优化操作
- 3.2PCA
-
- 总结
一、算法思想
由于算法原理比较复杂,推荐阅读通俗易懂的篇章:支持向量机通俗导论(理解SVM的三层境界)
这里主要讲的是SVM的用法,SVM分类算法的核心思想是通过建立某种核函数,将数据在高维寻找一个满足分类要求的超平面,使训练集中的点距离分类面尽可能的远,即寻找一个分类面使得其两侧的空白区域最大。如图下图所示,两类样本中离分类面最近的点且平行于最优分类面的超平面上的训练样本就叫做支持向量。

1.1svm.SVC()方法的使用
SVM分类算法在Sklearn机器学习包中,实现的类是 svm.SVC,即C-Support Vector Classification,它是基于libsvm实现的。构造方法如下:
svm.SVC(C=1.0,
	cache_size=200,
	class_weight=None,
	coef0=0.0,
	decision_function_shape=None,
	degree=3,
	gamma='auto',
	kernel='rbf',
	max_iter=-1,
	probability=False,
	random_state=None,
	shrinking=True,
	tol=0.001,
	verbose=False)
主要参数的作用:
- C表示目标函数的惩罚系数,用来平衡分类间隔margin和错分样本的,默认值为1.0;
- cache_size是制定训练所需要的内存(以MB为单位);
- class_weight表示每个类所占据的权重,不同的类设置不同的惩罚参数C,None为自适应;
- coef0是核函数中的独立项;
- decision_function_shape包括ovo(一对一)、ovr(多对多)或None(默认值)。
- degree决定了多项式的最高次幂;
- gamma是核函数的系数,默认是gamma=1/n_features;
- kernel 可以选择rbf、linear、poly、sigmoid,默认的是rbf;
- max_iter表示最大迭代次数,默认值为1;
1.2SVC方法主要步骤
- 训练:clf.fit(data, target)
- 预测:pre = clf.predict(data)
1.3SVC简单使用例题
鸢尾花iris数据集中,Class 类别变量中0表示山鸢尾,1表示变色鸢尾,2表示维吉尼亚鸢尾。
from sklearn import datasets # 导入iris数据集
from sklearn import svm      # 导入SVM
import numpy as np

# 数据集
np.random.seed(0)
iris=datasets.load_iris()
iris_x=iris.data
iris_y=iris.target
indices = np.random.permutation(len(iris_x))# 一个随机排列函数,就是将输入的数据进行随机排列
iris_x_train = iris_x[indices[:-10]]        # 训练集
iris_y_train = iris_y[indices[:-10]]        # 训练样本类别
iris_x_test = iris_x[indices[-10:]]         # 测试集
iris_y_test = iris_y[indices[-10:]]         # 测试样本类别

# 模型
clf = svm.SVC(kernel = 'linear')
clf.fit(iris_x_train,iris_y_train)           # 训练
iris_y_predict = clf.predict(iris_x_test)    # 预测
score=clf.score(iris_x_test,iris_y_test,sample_weight=None)# 返回对于以X为samples、y为target的预测效果评分。
print('iris_y_test = ')
print(iris_y_test)
print('iris_y_predict = ')
print(iris_y_predict)
print('Accuracy:',score)
输出为:第二个位置预测是错误的,导致预测效果评分为0.9。
iris_y_test =
[1 1 1 0 0 0 2 1 2 0]
iris_y_predict =
[1 2 1 0 0 0 2 1 2 0]
Accuracy: 0.9
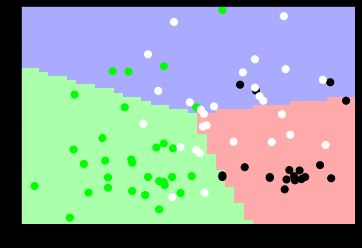
二、用SVM分析红酒数据
红酒数据下载链接:https://archive.ics.uci.edu/ml/machine-learning-databases/wine/
用SVM算法分析wine数据的代码为:
import os
import numpy as np
from sklearn.svm import SVC  # 导入SVC
from sklearn import metrics  # 导入metrics中使用classification_report方法
import matplotlib.pyplot as plt
from matplotlib.colors import ListedColormap

# 第一步 加载数据集
path = "wine.txt" # 文件路径
data = np.loadtxt(path,dtype=float,delimiter=",") # 读取txt文件数据
# print(data)

# 第二步 划分数据集
yy, x = np.split(data, (1,), axis=1) # 红酒数据中13列特征为x(data),第一列为类标yy(1,)
print(yy.shape, x.shape)
y = []
for n in yy:  # 将类标浮点型转化为整数
    y.append(int(n))
x = x[:, :2]  # 获取x前两列数据,方便绘图 对应x、y轴
train_data = np.concatenate((x[0:40,:], x[60:100,:], x[140:160,:]), axis = 0) # 训练集
train_target = np.concatenate((y[0:40], y[60:100], y[140:160]), axis = 0)     # 样本类别
test_data = np.concatenate((x[40:60, :], x[100:140, :], x[160:,:]), axis = 0) # 测试集
test_target = np.concatenate((y[40:60], y[100:140], y[160:]), axis = 0)       # 样本类别
print(train_data.shape, train_target.shape)
print(test_data.shape, test_target.shape)
print('真实值为:')
print(test_target)

# 第三步 SVC训练
clf = SVC()
clf.fit(train_data,train_target) # 训练
result = clf.predict(test_data)  # 预测
print('预测值为:')
print(result) # 输出预测结果的78个测试数据

# 第四步 评价算法
print(sum(result==test_target))                            # 预测结果与真实结果比对
print(metrics.classification_report(test_target, result))  # 准确率 召回率 F值 support

# 第五步 创建网格
x1_min, x1_max = test_data[:,0].min()-0.1, test_data[:,0].max()+0.1    # 第一列数据的最小值和最大值
x2_min, x2_max = test_data[:,1].min()-0.1, test_data[:,1].max()+0.1    # 第二列数据的最小值和最大值
xx, yy = np.meshgrid(np.arange(x1_min, x1_max, 0.1),
                     np.arange(x2_min, x2_max, 0.1))                   # 生成网格型数据
z = clf.predict(np.c_[xx.ravel(), yy.ravel()])# 将xx和yy矩阵都变成两个一维数组,调用np.c_[]函数组合成一个二维数组进行预测

# 第六步 绘图可视化
cmap_light = ListedColormap(['#FFAAAA', '#AAFFAA', '#AAAAFF'])         # 颜色Map
cmap_bold = ListedColormap(['#000000', '#00FF00', '#FFFFFF'])
plt.figure()
z = z.reshape(xx.shape) # 调用reshape()函数修改形状,将其Z转换为两个特征(长度和宽度)
print(xx.shape, yy.shape, z.shape, test_target.shape)
plt.pcolormesh(xx, yy, z, cmap=cmap_light) # 调用pcolormesh()函数来分类区域画图
plt.scatter(test_data[:,0], test_data[:,1], c=test_target,
            cmap=cmap_bold, s=50)# x为test_data[:,0]\[:,1],y为test_target测试真实标签,s为设置大小
plt.show()
代码提取了178行数据的第一列作为类标,剩余13列数据作为13个特征的数据集,并划分为训练集(100行)和测试集(78行)。输出结果如下,包括78行SVM分类预测的类标结果,其中54行数据类标与真实的结果一致,其准确率为0.69,召回率为0.69,F1特征为0.69。
真实值为:
[1 1 1 1 1 1 1 1 1 1 1 1 1 1 1 1 1 1 1 2 2 2 2 2 2 2 2 2 2 2 2 2 2 2 2 2 2
 2 2 2 2 2 2 2 2 2 2 2 2 2 3 3 3 3 3 3 3 3 3 3 3 3 3 3 3 3 3 3 3 3 3 3 3 3
 3 3 3 3]
预测值为:
[1 3 1 3 2 3 1 1 1 1 2 1 1 1 1 1 1 1 1 2 2 2 2 2 2 2 2 2 2 2 2 2 2 2 2 2 2
 2 3 2 2 2 3 3 3 2 2 2 2 3 2 1 2 3 2 2 3 3 3 1 3 1 1 3 1 3 3 3 1 3 2 2 1 3
 3 3 1 3]
54
              precision    recall  f1-score   support

           1       0.64      0.74      0.68        19
           2       0.76      0.84      0.80        31
           3       0.64      0.50      0.56        28

    accuracy                           0.69        78
   macro avg       0.68      0.69      0.68        78
weighted avg       0.69      0.69      0.69        78

(53, 36) (53, 36) (53, 36) (78,)
三、SVM分析红酒数据集的进一步优化
3.1代码优化操作
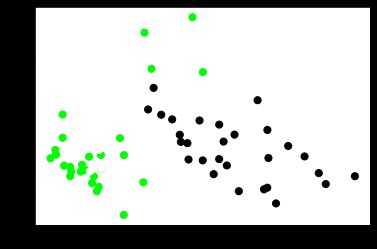
SVM分析红酒数据集的代码存在两个缺点,一是采用固定的组合方式划分的数据集,即调用np.concatenate()函数将0-40、60-100、140-160行数据分割为训练集,其余为预测集;二是只提取了数据集中的两列特征进行SVM分析和可视化绘图,即调用“x = x[:, :2]”获取前两列特征,而红酒数据集共有13列特征。
而红酒真实的数据分析中通常会随机划分数据集,分析过程也是对所有的特征进行训练及预测操作,再经过降维处理之后进行可视化绘图展示。下面进行代码的简单优化步骤为:
- 随机划分红酒数据集
- 对随机的红酒数据集的所有特征进行训练和预测分析
- 采用PCA算法降维后再进行可视化绘图操作
import os
import numpy as np
from sklearn.svm import SVC
from sklearn import metrics
import matplotlib.pyplot as plt
from matplotlib.colors import ListedColormap
from sklearn.model_selection import train_test_split
from sklearn.decomposition import PCA  # 导入PCA

# 第一步 加载数据集
path = "wine.txt" # 文件路径
data = np.loadtxt(path,dtype=float,delimiter=",") # 读取txt文件数据
# print(data)

# 第二步 划分数据集
yy, x = np.split(data, (1,), axis=1) # 红酒数据中13列特征为x(data),第一列为类标yy(1,)
# print(yy.shape, x.shape)
y = []
for n in yy:  # 将类标浮点型转化为整数
    y.append(int(n))
# 随机获取数据
y =  np.array(y, dtype = int) # list转换数组
# 划分数据集 测试集40% x为样本特征,y为样本结果,test_size表示测试样本占比,random_state是随机数的种子。
train_data, test_data, train_target, test_target = train_test_split(x, y, test_size=0.4, random_state=42)
print(train_data.shape, train_target.shape)
print(test_data.shape, test_target.shape)

# 第三步 SVC训练
clf = SVC()
clf.fit(train_data, train_target) # 训练
result = clf.predict(test_data)   # 预测
print('真实值为:')
print(test_target)
print('预测值为:')
print(result)                     # 输出预测结果的78个测试数据

# 第四步 评价算法
print(sum(result==test_target))                            # 预测结果与真实结果比对
print(metrics.classification_report(test_target, result))  # 准确率 召回率 F值 support

# 第五步 降维操作
pca = PCA(n_components=2)               # 观测数据,设k为2
newData = pca.fit_transform(test_data) # 对test_data数据降维操作

# 第六步 绘图可视化
plt.figure()
cmap_bold = ListedColormap(['#000000', '#00FF00', '#FFFFFF']) # 颜色Map
plt.scatter(newData[:,0], newData[:,1], c=test_target, cmap=cmap_bold, s=50)
plt.show()
输出为:其准确率、召回率和F值都减低,分别为66%、65%和65%。
(106, 13) (106,)
(72, 13) (72,)
真实值为:
[1 1 3 1 2 1 2 3 2 3 1 3 1 2 1 2 2 2 1 2 1 2 2 3 3 3 2 2 2 1 1 2 3 1 1 1 3
 3 2 3 1 2 2 2 3 1 2 2 3 1 2 1 1 3 3 2 2 1 2 1 3 2 2 3 1 1 1 3 1 1 2 3]
预测值为:
[3 1 2 1 2 1 2 3 3 3 3 2 1 2 1 2 2 2 1 2 1 2 3 2 2 2 2 3 2 1 1 2 3 1 1 1 3
 2 3 2 1 2 2 3 2 1 3 2 3 1 2 1 1 3 2 3 3 1 2 1 2 2 3 3 1 1 1 1 3 1 1 2]
47
              precision    recall  f1-score   support

           1       0.92      0.88      0.90        26
           2       0.61      0.63      0.62        27
           3       0.37      0.37      0.37        19

    accuracy                           0.65        72
   macro avg       0.63      0.63      0.63        72
weighted avg       0.66      0.65      0.65        72
- 但是采用决策树进行分析,则其准确率、召回率和F值就很高,结果如下所示。所以并不是每种分析算法都适应所有的数据集,不同数据集其特征不同,最佳分析的算也会不同,我们在进行数据分析时,通常会对比多种分析算法,再优化自己的实验和模型。
from sklearn.tree import DecisionTreeClassifier
clf = DecisionTreeClassifier()
print(metrics.classification_report(test_target, result))
输出为
#             precision    recall  f1-score   support
#
#          1       0.96      0.88      0.92        26
#          2       0.90      1.00      0.95        27
#          3       1.00      0.95      0.97        19
#
#   accuracy                           0.94        72
#  macro avg       0.90      0.92      0.89        72
#avg / total       0.95      0.94      0.94        72
3.2PCA
主成分分析(principal component analysis)是一种常见的数据降维方法,其目的是在“信息”损失较小的前提下,将高维的数据转换到低维,从而减小计算量。
PCA的本质就是找一些投影方向,使得数据在这些投影方向上的方差最大,而且这些投影方向是相互正交的。这其实就是找新的正交基的过程,计算原始数据在这些正交基上投影的方差,方差越大,就说明在对应正交基上包含了更多的信息量。
在实际使用中,用sklearn封装的PCA方法,做PCA的代码如下。PCA方法参数n_components,如果设置为整数,则n_components=k。如果将其设置为小数,则说明降维后的数据能保留的信息。所以在实际使用PCA时,我们不需要选择k,而是直接设置n_components为float数据。
PCA(n_components=k)
n_components:
意义:PCA算法中所要保留的主成分个数n,也即保留下来的特征个数n
类型:int 或者 string,缺省时默认为None,所有成分被保留。 当赋值为int,比如n_components=1,将把原始数据降到一个维度。当赋值为string,比如n_components=‘mle’,将自动选取特征个数n,使得满足所要求的方差百分比。
- PCA主成分数量k的选择,是一个数据压缩的问题。通常我们直接将sklearn中PCA方法参数n_components设置为float数据,来间接解决k值选取问题。 但有的时候我们降维只是为了观测数据(visualization),这种情况下一般将k选择为2或3。
总结
SVM算法分析的六个步骤:
- 第一步,加载数据集。
采用loadtxt()函数加 - 载酒类数据集,采用逗号(,)分割。 - 第二步,划分数据集。
将Wine数据集划分为训练集和预测集,仅提取酒类13个特种中的两列特征进行数据分析。 - 第三步,SVM训练。
导入Sklearn机器学习包中svm.SVC()函数分析,调用fit()函数训练模型,predict(test_data)函数预测分类结果。 - 第四步,评价算法。
通过classification_report()函数计算该分类预测结果的准确率、召回率和F值、support。 - 第五步,创建网格。
获取数据集中两列特征的最大值和最小值,并创建对应的矩阵网格,用于绘制背景图,调用numpy扩展包的meshgrid()函数实现。 - 第六步,绘图可视化。
设置不同类标的颜色,调用pcolormesh()函数绘制背景区域颜色,调用scatter()函数绘制实际结果的散点图。
若要将SVM算法进一步优化(随机划分数据集)则需将第五步的创建网格改为降维操作。

