【Python数据处理篇——DataFrame数据可视化】饼图、散点图、折线图、柱形图、直方图
欢迎访问我搞事情的【知乎账号】:Coffee
以及我的【B站漫威剪辑账号】:VideosMan
若我的笔记对你有帮助,请用小小的手指,点一个大大的赞哦。
关于DataFrame的相关知识,我还进行了汇总,欢迎点赞收藏!!
【Python学习笔记—保姆版】第四章—关于Pandas、数据准备、数据处理、数据分析、数据可视化
Python数据处理篇——DataFrame数据可视化
- 5、数据可视化
-
- 相关注意
- 4.5.1 饼图:plt.pie(gb2.人数,labels=gb2.index,autopct='%.2f%%',colors=['b','pink',(0.5,0.8,0.3)],explode=[0,0,0,0,0.1])
- 4.5.2 散点图:plt.plot(df.高代,df.数分,'o',color='pink')
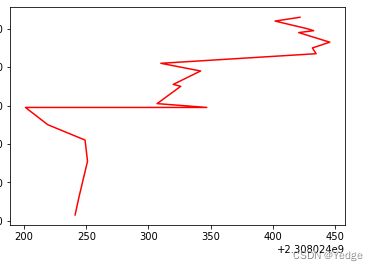
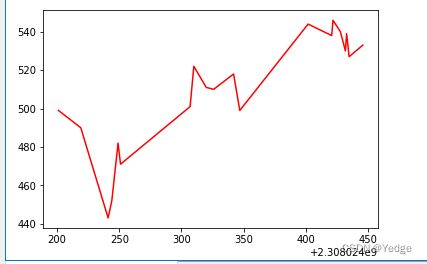
- 4.5.3 折线图:plt.plot(df.学号,df.总分,'-',color='r')
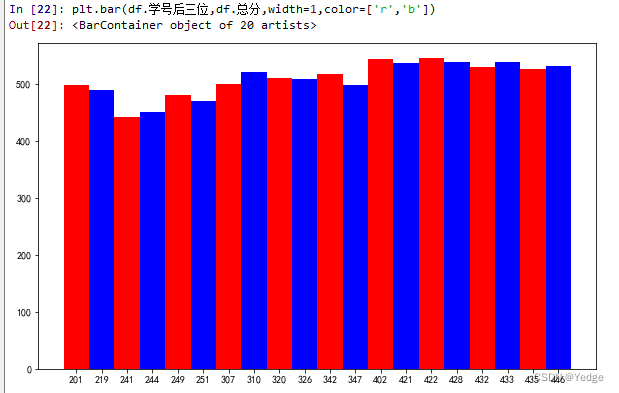
- 4.5.4 柱形图:plt.bar(df.学号后三位,df.总分,width=1,color=['r','b'])
- 4.5.5 直方图:plt.hist(df2.C语言程序设计,bins=10,color='g',cumulative=True)
5、数据可视化
相关注意
4.4Python数据处理篇之Matplotlib系列(四)—plt.bar()与plt.barh条形图
拉出长画布
fig = plt.figure(figsize=(12,4)) # 设置画布大小
调整标签字体大小
plt.tick_params(axis='x', labelsize=8) # 设置x轴标签大小
标签旋转
plt.bar(df['sport_type'], df['score'])
4.5.1 饼图:plt.pie(gb2.人数,labels=gb2.index,autopct=‘%.2f%%’,colors=[‘b’,‘pink’,(0.5,0.8,0.3)],explode=[0,0,0,0,0.1])
饼图(Pie Graph):又称圆形图,是一个划分为几个扇形的圆形统计图,它能够直观的反映个体与总体的比例关系
pie(x,labels,colors,explode,autopct)

x         进行绘图的序列
labels     饼图的各部分标签
colors     饼图的各部分颜色,使用GRB标颜色
explode    需要突出的块状序列
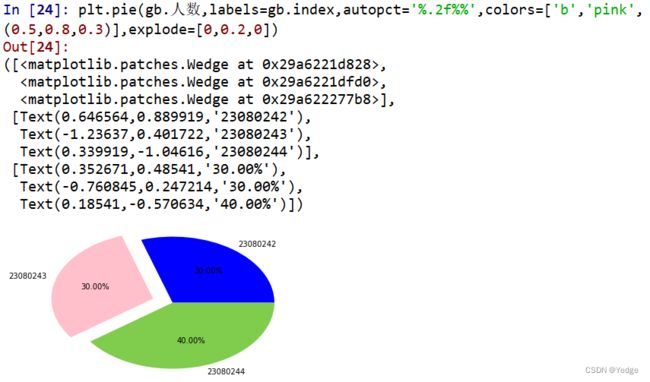
autopct    饼图占比的显示格式,%.2f:保留两位小数
import numpy as np
import pandas as pd
import matplotlib.pyplot as plt

df = pd.read_excel(r'E:\Python\第4章数据\rz4.xlsx')
df

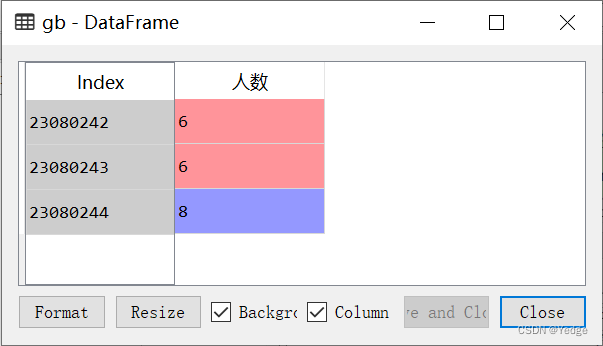
gb=df.groupby(by=['班级'])['学号'].agg([('人数',np.size)])
plt.pie(gb.人数,labels=gb.index,autopct='%.2f%%',colors=['b','pink',(0.5,0.8,0.3)],explode=[0,0.2,0])
练习
df2= pd.read_excel(r'E:\Python\第4章数据\09电动1.xls')
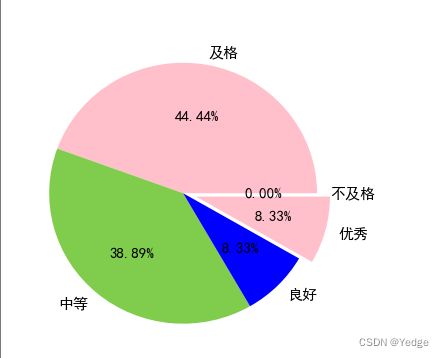
df2['C语言程序设计']=pd.cut(df2.C语言程序设计,bins=[0,60,70,80,90,101],right=False,labels=['不及格','及格','中等','良好','优秀']) #right=False 控制左闭右开
gb2=df2.groupby(by=['C语言程序设计'])['学号'].agg([('人数',np.size)]).fillna(0)  #fillna(0)填充空值
plt.pie(gb2.人数,labels=gb2.index,autopct='%.2f%%',colors=['b','pink',(0.5,0.8,0.3)],explode=[0,0,0,0,0.1])
plt.rcParams['font.sans-serif']=['SimHei']  #字体
plt.rcParams['font.size']=30  #字体大小
plt.rcParams['figure.figsize']=[6,6]   #正圆
-
plt.rcParams,显示设值字体的东西
plt.rcParams

plt.rcParams['font.sans-serif']
Out[43]:
['DejaVu Sans',
 'Bitstream Vera Sans',
 'Computer Modern Sans Serif',
 'Lucida Grande',
 'Verdana',
 'Geneva',
 'Lucid',
 'Arial',
 'Helvetica',
 'Avant Garde',
 'sans-serif']

plt.rcParams['font.sans-serif']=['SimHei']
plt.rcParams['font.sans-serif']=['SimHei','...','...'] #没有的往后找
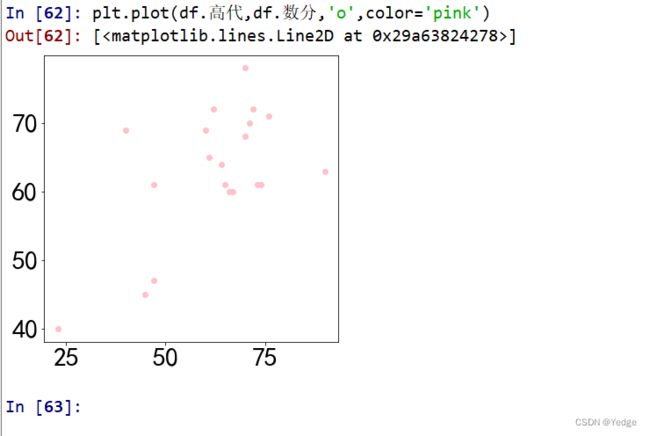
4.5.2 散点图:plt.plot(df.高代,df.数分,‘o’,color=‘pink’)
散点图(scatter diagram):是以一个变量为横坐标,另一个变量为纵坐标,利用散点(坐标点)的分布形态反映变量关系的一种图形。
plot(x,y, '. ',color=(r,g,b))
plt.xlabel('x轴坐标')
plt.ylabel('y轴坐标')
plt.grid(Ture)
x、y        X轴和Y轴的序列
'. '、'o'      小点还是大点
Color       散点图的颜色,可以用rgb定义,也可以用英文字母定义
RGB颜色的设置:(red,green,blue)  红绿蓝颜色组成
df = pd.read_excel(r'E:\Python\第4章数据\rz4.xlsx')
df

gb=df.groupby(by=['班级'])['学号'].agg([('人数',np.size)])
plt.plot(df.英语,df.数分,'.',color='g')
plt.xlabel('英语')
plt.xlabel('数分')
plt.plot(df.高代,df.数分,'o',color='pink')
plt.plot(df.高代,df.数分,'o',color='pink')
plt.plot(df.高代,df.数分,'-',color='pink') #连线
4.5.3 折线图:plt.plot(df.学号,df.总分,‘-’,color=‘r’)
| 参数值 | 注释 |
|---|---|
| - | 连续的曲线 |
| — | 连续的虚线 |
| -. | 连续的用带点的曲线 |
| : | 由点连成的曲线 |
| . | 小点,散点图 |
| o | 大点,散点图 |
| , | 像素点(更小的点)的散点图 |
| * | 五角星的点散点图 |
| > | 右角标记散点图 |
| < | 左角标记散点图 |
| 1(2,3,4) | 伞形上(下左右)标记散点图 |
| s | 正方形标记散点图 |
| p | 五角星标记散点图 |
| v | 下三角标记散点图 |
| ^ | 上三角标记散点图 |
| h | 多边形标记散点图 |
| d | 钻石标记散点图 |
       df = pd.read_excel(r'E:\Python\第4章数据\rz4.xlsx')
       df
       plt.plot(df.学号,df.总分,'-',color='r')
学号 班级 姓名 性别 英语 体育 军训 数分 高代 解几 计算机基础 总分
0 2308024241 23080242 成龙 男 76 78 77 40 23 60 89 443
1 2308024244 23080242 周怡 女 66 91 75 47 47 44 82 452
2 2308024251 23080242 张波 男 85 81 75 45 45 60 80 471
3 2308024249 23080242 朱浩 男 65 50 80 72 62 71 82 482
4 2308024219 23080242 封印 女 73 88 92 61 47 46 83 490
5 2308024201 23080242 迟培 男 60 50 89 71 76 71 82 499
6 2308024347 23080243 李华 女 67 61 84 61 65 78 83 499
7 2308024307 23080243 陈田 男 76 79 86 69 40 69 82 501
8 2308024326 23080243 余皓 男 66 67 85 65 61 71 95 510
9 2308024320 23080243 李嘉 女 62 60 90 60 67 77 95 511
10 2308024342 23080243 李上初 男 76 90 84 60 66 60 82 518
11 2308024310 23080243 郭窦 女 79 67 84 64 64 79 85 522
12 2308024435 23080244 姜毅涛 男 77 71 87 61 73 76 82 527
13 2308024432 23080244 赵宇 男 74 74 88 68 70 71 85 530
14 2308024446 23080244 周路 女 76 80 77 61 74 80 85 533
15 2308024421 23080244 林建祥 男 72 72 81 63 90 75 85 538
16 2308024433 23080244 李大强 男 79 76 77 78 70 70 89 539
17 2308024428 23080244 李侧通 男 64 96 91 69 60 77 83 540
18 2308024402 23080244 王慧 女 73 74 93 70 71 75 88 544
19 2308024422 23080244 李晓亮 男 85 60 85 72 72 83 89 546
df=df.sort_values('学号')
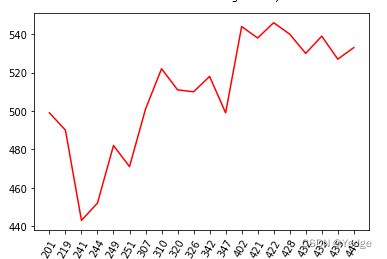
     df['学号后三位']=df.学号.astype(str).str.slice(-3,) #分离学号后三位,并加入新一列(不会影响df)
     plt.plot(df.学号后三位,df.总分,'-',color='r')  #画图
     plt.xticks(rotation=60)  #标签旋转度数
      df2= pd.read_excel(r'E:\Python\第4章数据\09电动1.xls')
      plt.plot(df2.姓名,df2.C语言程序设计,'--',color='g')
      plt.xlabel('姓名')
      plt.ylabel('C语言程序设计')
      plt.xticks(rotation=90)
      plt.rcParams['font.sans-serif']=['SimHei']
      plt.rcParams['figure.figsize']=[10,6]
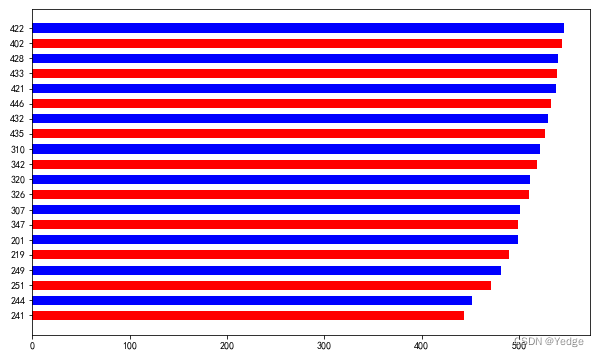
4.5.4 柱形图:plt.bar(df.学号后三位,df.总分,width=1,color=[‘r’,‘b’])
柱形图用于显示一段时间内的数据变化或显示各项之间的比较情况,是一种单位长度的长方形,根据数据大小绘制的统计图,用来比较两个或以上的数据(时间或类别)。
 bar(left,height,width,color)
 barh(bottom,width,height,color)
 left      x轴的位置序列,一般采用arange函数产生一个序列
 height    y轴的数值序列,也就是柱形图高度,一般就是我们需要展示的数据
 width    柱形图的宽度,一般设置为1即可
 color    柱形图填充颜色
df['学号后三位']=df.学号.astype(str).str.slice(-3,)
plt.bar(df.学号后三位,df.总分,width=1,color=['r','b'])  #柱形图
plt.xticks(rotation=60)

plt.barh(df.学号后三位,df.总分,0.6,color=['r','b'])  #条形图
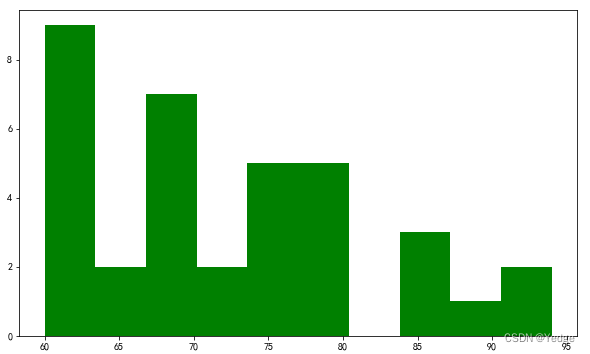
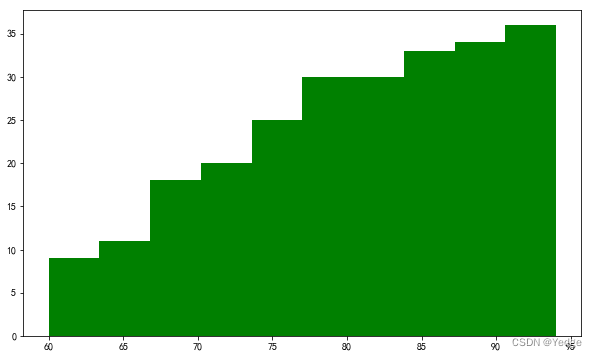
4.5.5 直方图:plt.hist(df2.C语言程序设计,bins=10,color=‘g’,cumulative=True)
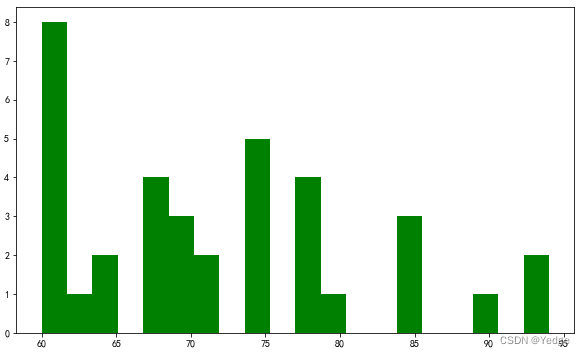
直方图(Histogram):是用一系列等宽不等高的长方形来绘制,宽度表示数据范围的间隔,高度表示在给定间隔内数据出现的频数,变化的高度形态表示数据的分布情况。
用来查看数据的频率
hist(x,color,bins,cumulative=False)
	  x           需要进行绘制的向量
	  color        直方图填充的颜色
	  bins         设置直方图的分组个数
	  cumulative   设置是否累积计数,默认是False
df2= pd.read_excel(r'E:\Python\第4章数据\09电动1.xls')
plt.hist(df2.C语言程序设计,bins=10,color='g',cumulative=False)
plt.hist(df2.C语言程序设计,bins=10,color='g',cumulative=True)
