吴恩达机器学习之逻辑回归(二分类)
吴恩达机器学习之逻辑回归
- 逻辑回归
-
- 二分类逻辑回归
-
- 二分类逻辑回归案例
- python代码实现(含详细代码注释):
- 案例中几个问题的解析
-
- 不同于线性回归,逻辑回归的hθ(x)还需要用sigmoid函数处理,这是为什么?
- 代价函数的推导
- 代价函数对θ求偏导数的推导
- 正则化逻辑回归
-
- 正则化逻辑回归案例
- python代码实现:
- 案例中几个问题的解析
-
- 为什么不需要对θ1进行正则化
- 为什么要引入正则化
- 数据集的链接
逻辑回归
二分类逻辑回归
二分类逻辑回归案例
在训练的初始阶段,我们将要构建一个逻辑回归模型来预测,某个学生是否被大学录取。
设想你是大学相关部分的管理者,想通过申请学生两次测试的评分,来决定他们是否被录取。
现在你拥有之前申请学生的可以用于训练逻辑回归的训练样本集。对于每一个训练样本,你有他们两次测试的评分和最后是被录取的结果。
python代码实现(含详细代码注释):
import numpy as np
import pandas as pd
import matplotlib.pyplot as plt
import scipy.optimize as opt
path = ‘D:/学习/python/数据集/ex2data1.txt’ #数据集是在github上下载的 在最后会给出下载的链接
data = pd.read_csv(path, header=None, names=[‘Exam 1’, ‘Exam 2’, ‘Admitted’])
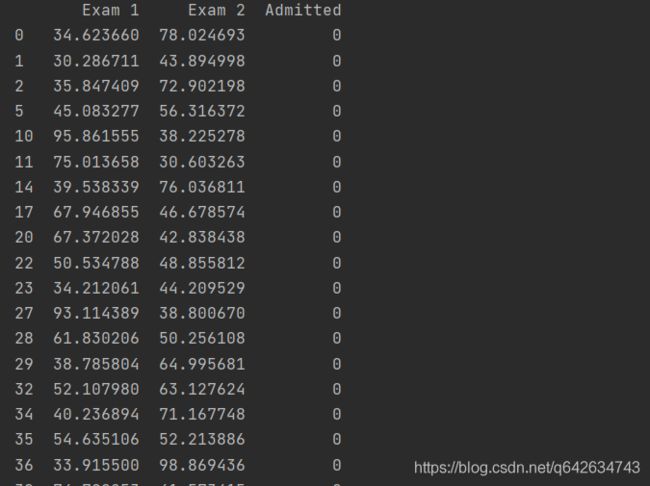
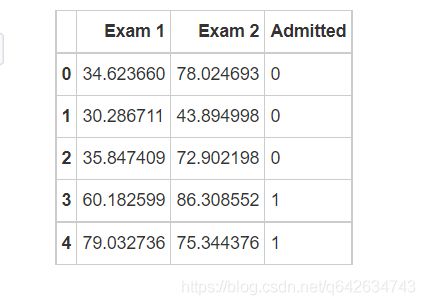
print(data.head()) #一共有100个样本,这里只显示前五行看看
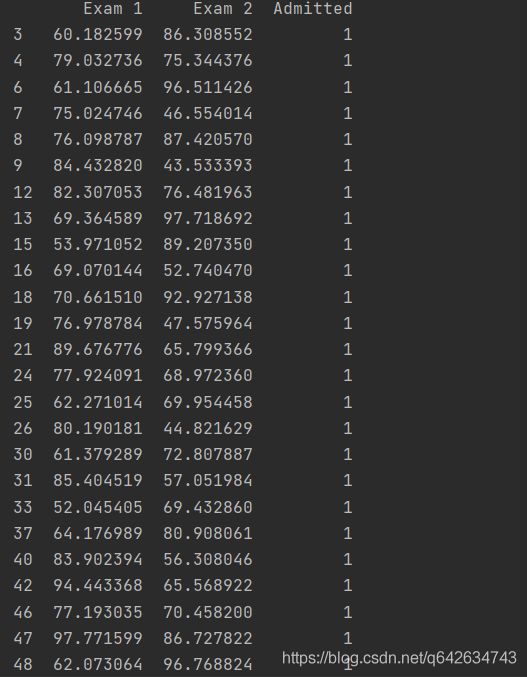
positive = data[data[‘Admitted’].isin([1])] # 筛选出被录取的数据的那一行。 isin函数选取一列中出现同样的数值或字符串中的那一行
negative = data[data[‘Admitted’].isin([0])] # 筛选出未被录取的数据的那一行
#print(positive)
#等价于fig = plt.subplots() ax = fig.add.subplot(1,1,1)
#fig.subplot(1,1,1)第一个1参数是子图的行数,第二个3参数是子图的列数 第三个1参数是代表第一个子图,如果想要设置子图的宽度和高度可以在函数内加入figsize值,单位为英寸。
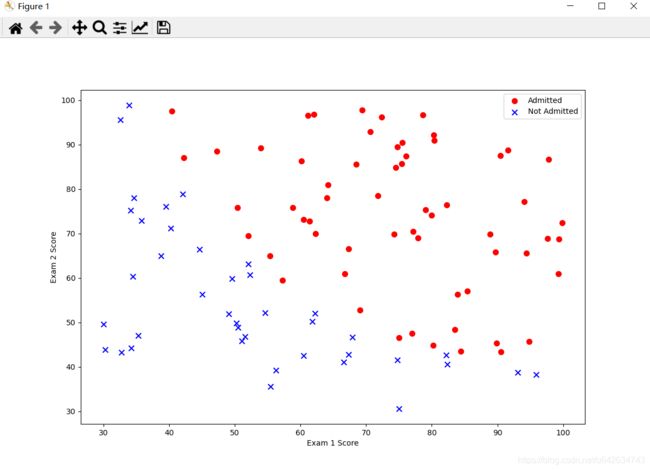
fig, ax = plt.subplots(figsize = (12,8))
#画出被录取和未被录取的散点图
ax.scatter(positive[‘Exam 1’], positive[‘Exam 2’], s=50, color=‘r’, marker=‘o’, label=‘Admitted’)
ax.scatter(negative[‘Exam 1’], negative[‘Exam 2’], s=50, color=‘b’, marker=‘x’, label=‘Not Admitted’
ax.legend() # legend()有一个loc参数,用于控制图例的位置。 比如 plot.legend(loc=2),这个位置就是4象项中的第二象项,也就是左上角。无参数时默认为第一象限
ax.set_xlabel(‘Exam 1 Score’) #给图像设置横坐标标签
ax.set_ylabel(‘Exam 2 Score’) #给图像设置纵坐标标签
plt.show() #显示图像,没有这行代码图像将不会显示
#实现sigmoid函数
def sigmoid(z):
return 1/(1+np.exp(-z)
#实现代价函数
def cost(theta, X, y):
theta = np.matrix(theta) #matrix将theta转换成矩阵形式
X = np.matrix(X)
y = np.matrix(y)
first = np.multiply(-y, np.log(sigmoid(X * theta.T))) #multiply函数作用是数组和矩阵对应位置相乘,输出与相乘数组/矩阵的大小一致
second = np.multiply((1-y), np.log(1-sigmoid(X * theta.T)))
return np.sum(first - second) / len(X)
#加一列常数项
data.insert(0, ‘Ones’, 1)
#初始化X, y, theta
cols = data.shape[1] # shape[1]返回为数据data的列数
X = data.iloc[:, 0:cols-1] #令X为data里除了最后一列的所有数据
y = data.iloc[:, cols-1:cols] #令y为data里最后一列的所有数据
theta = np.zeros(3) #初始化theta为1*3维的全0矩阵
#print(X.head())
#转换X,y的类型
X = np.array(X.values)
y = np.array(y.values)
print(cost(theta,X, y)) # 运行代价函数
![]()
#梯度下降函数(没有更新θ值)
def gradient(theta, X, y):
theta = np.matrix(theta)
X = np.matrix(X)
y = np.matrix(y)

parameters = int(theta.ravel().shape[1])
grad = np.zeros(parameters)

error = sigmoid(X * theta.T) - y

for i in range(parameters):
    term = np.multiply(error, X[:, i])
    grad[i] = np.sum(term) / len(X)

return grad
#使用高级优化算法,我们不用自己写代码实现梯度下降,我们会调用一个已有的库。这就是说,我们不用自己定义迭代次数和步长,功能会直接告诉我们最优解。
andrew ng在课程中用的是Octave的“fminunc”函数,由于我们使用Python,我们可以用scipy.optimize.fmin_tnc做同样的事情。
(另外,如果对fminunc有疑问的,可以参考下面这篇百度文库的内容https://wenku.baidu.com/view/2f6ce65d0b1c59eef8c7b47a.html )
result = opt.fmin_tnc(func=cost, x0=theta, fprime=gradient, args=(X, y))
#func:优化的目标函数
#x0:初值
#fprime:提供优化函数func的梯度函数,不然优化函数func必须返回函数值和梯度,或者设置approx_grad=True
#approx_grad :如果设置为True,会给出近似梯度
#args:元组,是传递给优化函数的参数
print(result)
print(cost(result[0], X, y))

plotting_x1 = np.linspace(30, 100, 100) # 表示在区间[30, 100]之间取100个点作为横坐标
#定义决策边界的直线,而result[0]是theta3个值的一个数组,result[0][0]表示从theta的三个值中取第一个值,即theta1
plotting_h1 = ( - result[0][0] - result[0][1] * plotting_x1) / result[0][2]
fig, ax = plt.subplots(figsize=(12,8))
ax.plot(plotting_x1, plotting_h1, ‘y’, label=‘Prediction’)
ax.scatter(positive[‘Exam 1’], positive[‘Exam 2’], s=50, c=‘b’, marker=‘o’, label=‘Admitted’)
ax.scatter(negative[‘Exam 1’], negative[‘Exam 2’], s=50, c=‘r’, marker=‘x’, label=‘Not Admitted’)
ax.legend()
ax.set_xlabel(‘Exam 1 Score’)
ax.set_ylabel(‘Exam 2 Score’)
plt.show()
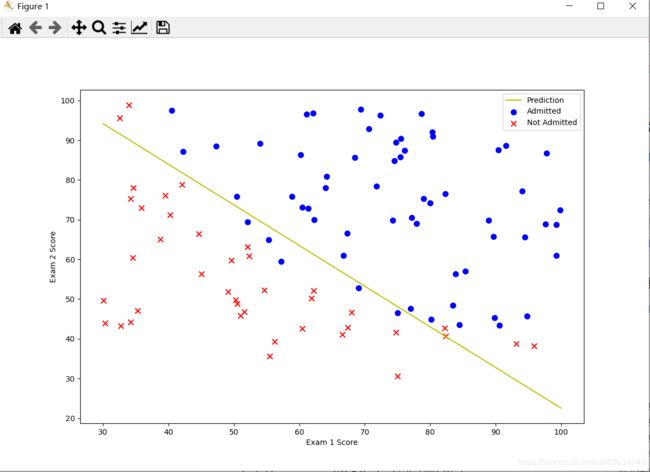
#在确定参数之后,我们可以使用这个模型来预测学生是否录取。如果一个学生exam1得分70,exam2得分85,那么他录取的概率应为0.9983411474141966
#实现hθ
def hfunc1(theta, X):
return sigmoid(np.dot(theta.T, X))
print(hfunc1(result[0],[1,45,85]))
![]()
#定义预测函数
def predict(theta, X):
probability = sigmoid(X * theta.T)   #计算hθ(x)
return [1 if x >= 0.5 else 0 for x in probability] #hθ(x)大于等于0.5,预测结果就为1,即被    录取,否则,预测结果为0,即未被录取
#统计预测正确率
theta_min = np.matrix(result[0])
predictions = predict(theta_min, X)
#判断是否预测正确,将结果写入correct里,预测正确为1,预测错误为0
correct = [1 if ((a == 1 and b == 1) or (a == 0 and b == 0)) else 0 for (a, b) in zip(predictions, y)]
#将correct里的数进行累加,因为correct中预测正确为1,预测错误的结果为0,所以累加后的结果就是预测正确的个数,再对预测过的样本个数求余,因为样本个数是100,所以后面加个百分号,就是预测正确的概率
accuracy = (sum(map(int, correct)) % len(correct))
#得出预测正确率等于89%
print(‘accuracy = {0}%’.format(accuracy))
![]()
案例中几个问题的解析
不同于线性回归,逻辑回归的hθ(x)还需要用sigmoid函数处理,这是为什么?
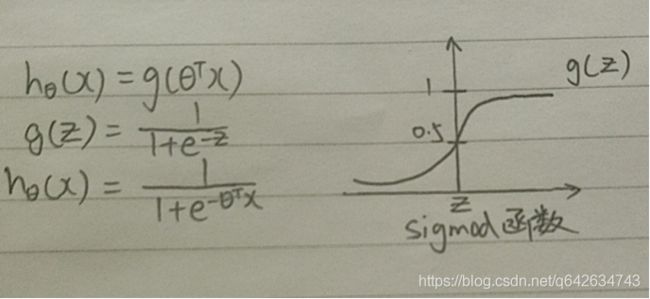
因为逻辑回归是一种分类算法,它需要hθ(x)的值在0到1之间,所以用sigmoid函数来处理线性回归的hθ(x),这样就使得hθ(x)的值处于0到1之间。由sigmoid函数图可以看出,当z大于0时,g(z)就大于0.5,即hθ(x)大于0.5,则θ的转置乘以x就大于0。所以可将hθ(x)大于0.5和小于0.5分成两类,一般以hθ(x)大于0.5为正类,hθ(x)小于0.5为负类,当θ的转置乘以x大于0即为正类,反之则为负类
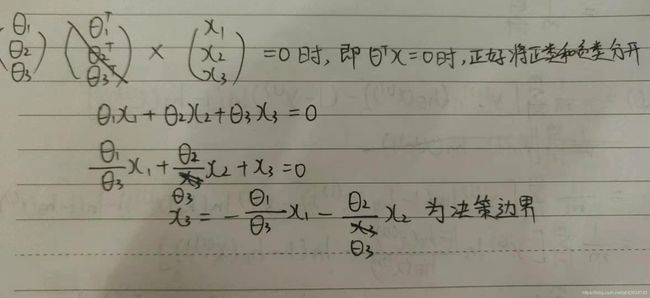
而hθ(x)等于0.5的那条直线为决策边界,将正类和负类分成两部分,这个决策边界不是根据数据集来判断的,而是取决于参数θ的值
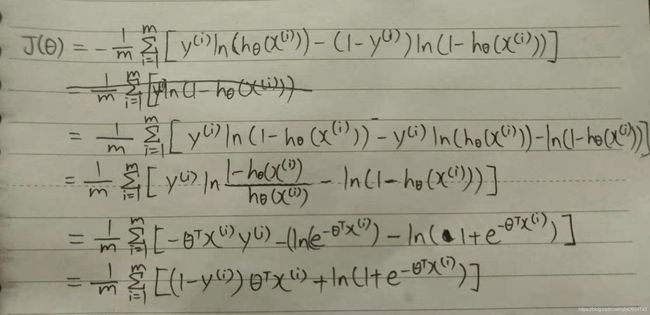
代价函数的推导
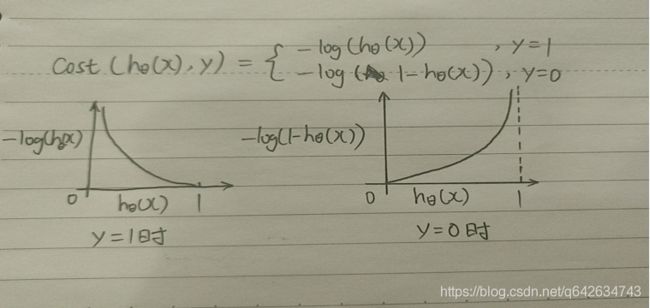
因为用sigmod函数处理后的hθ(x)是一个复杂的非凸函数,所以用log函数处理hθ(x)可以令hθ(x)的值保持在0到1。
由上图可以得知:代价函数改成这样的话,当y=1时,即样本结果为正类,根据y=1时的图像,当hθ(x)=1时,说明预测的结果跟实际样本结果一致,不需要惩罚,代价函数值为0,而当hθ(x)=0时,说明预测的结果跟实际样本结果偏差很大,所以受到的惩罚就越大,所以代价函数值接近无穷大。
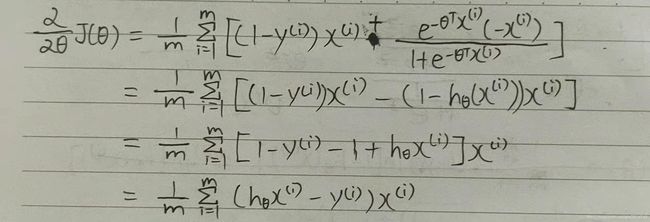
代价函数对θ求偏导数的推导
正则化逻辑回归
正则化逻辑回归案例
在训练的第二部分,我们将实现加入正则项提升逻辑回归算法。
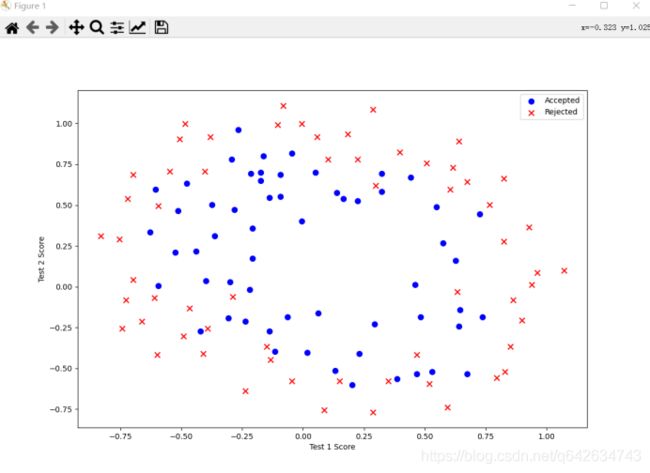
设想你是工厂的生产主管,你有一些芯片在两次测试中的测试结果,测试结果决定是否芯片要被接受或抛弃。你有一些历史数据,帮助你构建一个逻辑回归模型。
python代码实现:
import numpy as np
import pandas as pd
import matplotlib.pyplot as plt
import scipy.optimize as opt
‘’’
正则化逻辑回归和逻辑回归的思路基本相同(建议掌握了逻辑回归算法再来看逻辑回归的正则化),只是代价函数不同和代价函数对
θ求偏导的结果也不同,而且决策边界也不能直接用一条直线画出,需要采用数值的方法画出决策边界的曲线
‘’’
path = ‘D:/学习/python/数据集/ex2data2.txt’
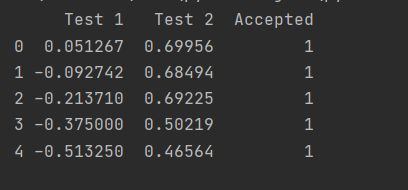
data_init = pd.read_csv(path, header=None, names=[‘Test 1’, ‘Test 2’, ‘Accepted’])
print(data_init.head())
positive2 = data_init[data_init[‘Accepted’].isin([1])]
negative2 = data_init[data_init[‘Accepted’].isin([0])]
fig, ax = plt.subplots(figsize=(12,8))
ax.scatter(positive2[‘Test 1’], positive2[‘Test 2’], s=50, c=‘b’, marker=‘o’, label=‘Accepted’)
ax.scatter(negative2[‘Test 1’], negative2[‘Test 2’], s=50, c=‘r’, marker=‘x’, label=‘Rejected’)
ax.legend()
ax.set_xlabel(‘Test 1 Score’)
ax.set_ylabel(‘Test 2 Score’)
plt.show()
#特征映射
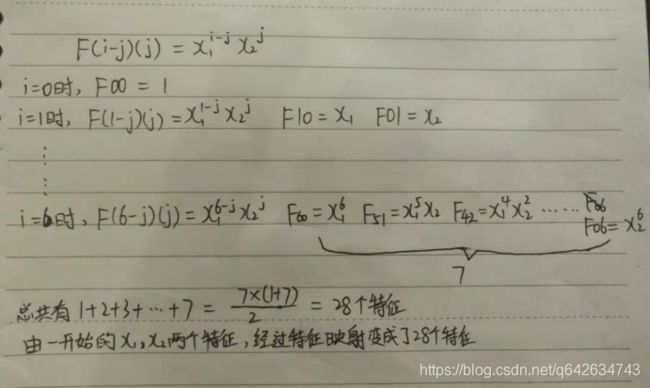
#一种更好的使用数据集的方式是为每组数据创造更多的特征。所以我们为每组添加了最高到6次幂的特征
degree = 6
data2 = data_init
x1 = data2[‘Test 1’]
x2 = data2[‘Test 2’]
data2.insert(3, ‘Ones’, 1)
def sigmoid(z):
return 1/(1+np.exp(-z))
#特征映射
for i in range(1, degree+1):
for j in range(0, i+1):
data2[‘F’ + str(i-j) + str(j)] = np.power(x1, i-j) * np.power(x2,j)
‘’’
drop函数默认删除行,列需要加axis = 1
往往都有一个 inplace可选参数。如果手动设定为True(默认为False),
那么原数组直接就被替换。也就是说,采用inplace=True之后,原数组名对应的内存值直接改变;
‘’’
data2.drop(‘Test 1’, axis=1, inplace=True)
data2.drop(‘Test 2’, axis=1, inplace=True)
#实现正则化后的代价函数:
def costReg(theta, X, y,learningRate):
theta = np.matrix(theta)
X = np.matrix(X)
y = np.matrix(y)
first = np.multiply(-y, np.log(sigmoid(X * theta.T)))
second = np.multiply(1-y,np.log(1 - sigmoid(X * theta.T)))
#theta[:, 1:theta.shape[1]]是因为不需要正则化theta1,所以取除一列的所有数据
reg = (learningRate / (2 * len(X))) * np.sum(np.power(theta[:, 1:theta.shape[1]], 2))
return np.sum(first - second) / len(X) + reg

#实现正则化的梯度函数:
def gradientReg(theta, X, y, learningRate):
theta = np.matrix(theta)
X = np.matrix(X)
y = np.matrix(y)
#ravel函数将theta变成一维,shape[1]取theta的列数
parameters = int(theta.ravel().shape[1])
grad = np.zeros(parameters)
error = sigmoid(X * theta.T) - y
for i in range(parameters):
    term = np.multiply(error, X[:, i])

    if(i == 0):
        grad[i] = np.sum(term) / len(X)
    else:
        grad[i] = (np.sum(term) / len(X)) + ((learningRate / len(X)) *           theta[:,i])
#初始化X, y, θ
cols = data2.shape[1]
X2 = data2.iloc[:, 1:cols]
y2 = data2.iloc[:, 0:1]
theta2 = np.zeros(cols-1) #data2中含有y,所以theta参数的个数是cols-1
X2 = np.array(X2.values)
y2 = np.array(y2.values)
#λ设为1
learningRate = 1
print(costReg(theta2, X2, y2, learningRate))
![]()
result2 = opt.fmin_tnc(func=costReg, x0=theta2, fprime=gradientReg, args=(X2, y2, learningRate))
print(result2)

#定义预测函数
def predict(theta, X):
probability = sigmoid(X * theta.T)   #计算hθ(x)
return [1 if x >= 0.5 else 0 for x in probability]
#计算预测正确率
theta_min = np.matrix(result2[0])
predictions = predict(theta_min, X2)
correct = [1 if ((a == 1 and b == 1) or (a == 0 and b == 0)) else 0 for (a, b) in zip(predictions, y2)]
accuracy = (sum(map(int, correct)) % len(correct))
print (‘accuracy = {0}%’.format(accuracy))
![]()
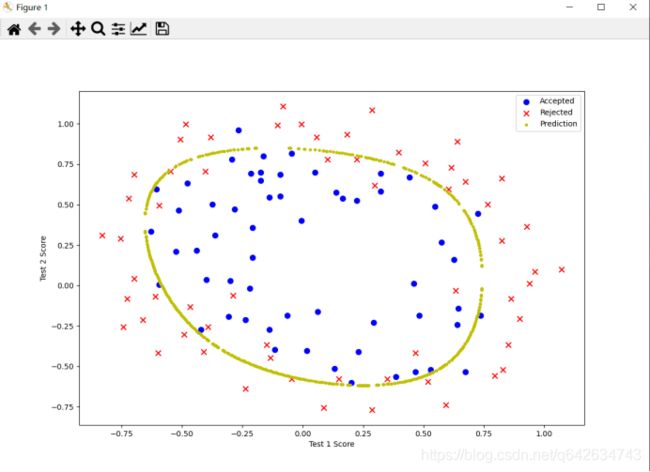
‘’’
根据图像我们用一条直线来画出决策边界显然不实际,所以我们需要用数值的方法来画出决策边界,我们在图的一个范围里,遍历所有的像素点,
只要让X * theta.T = 0的坐标点全部连起来就是我们的决策边界。但是我们知道这些离散的点X * theta.T不一定就能等于0,所以我们只要设置一个Σ,
只要小于Σ,就算是符合决策边界上的点,这里我们把Σ设置成0.002
‘’’
#画出决策曲线
def hfunc2(theta, x1, x2):
  temp = theta[0][0]
  place = 0
  for i in range(1, degree+1):
      for j in range(0, i+1):
          temp += np.power(x1, i-j) * np.power(x2, j) * theta[0][place+1]
          place+=1
  return temp
def find_decision_boundary(theta):
  t1 = np.linspace(-1, 1.5, 1000) #从-1到1.5拆分成1000份的数组
  t2 = np.linspace(-1, 1.5, 1000)

  #cordinates为坐标图t1和t2构成的图的每一个坐标
  cordinates = [(x, y) for x in t1 for y in t2]

  #将(x,y)坐标拆分成x_cord和y_cord
  x_cord, y_cord = zip(*cordinates)
  h_val = pd.DataFrame({'x1':x_cord, 'x2':y_cord})

  #将2维的特征,映射成28维
  h_val['hval'] = hfunc2(theta, h_val['x1'], h_val['x2'])

  '''
  判断每个像素点的 |X * theta.T| < 0.002,如果是,则将该样本的28个特征放在        decision,而这些样本都是在决策边界上的点
  '''
  decision = h_val[np.abs(h_val['hval']) < 2 * 10**-3]


  '''
  decision的x1,x2表示在决策边界上的x1,x2.而原始数据的x1,x2就分别相当于图上的x,y 所以绘制以decision上的x1,x2为横纵坐标的图像就是决策边界
  '''
  return decision.x1, decision.x2
fig, ax = plt.subplots(figsize=(12,8))
ax.scatter(positive2[‘Test 1’], positive2[‘Test 2’], s=50, c=‘b’, marker=‘o’, label=‘Accepted’)
ax.scatter(negative2[‘Test 1’], negative2[‘Test 2’], s=50, c=‘r’, marker=‘x’, label=‘Rejected’)
ax.set_xlabel(‘Test 1 Score’)
ax.set_ylabel(‘Test 2 Score’)
x, y = find_decision_boundary(result2)
plt.scatter(x, y, c=‘y’, s=10, label=‘Prediction’)
ax.legend()
plt.show()
案例中几个问题的解析
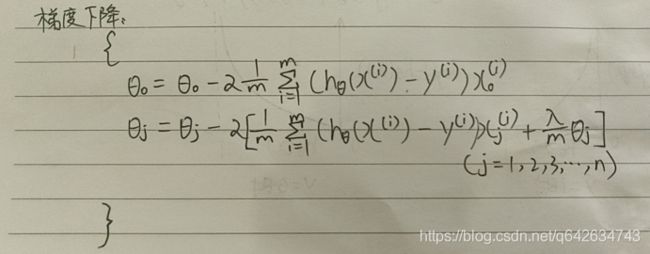
为什么不需要对θ1进行正则化
因为逻辑回归正则化之后的代价函数跟逻辑回归的代价函数区别就在于加上了一个值,如上图所示,因为我们需要代价函数尽可能小,而逻辑回归函数代价函数是固定的,所以需要后面的尽可能小,所以我们就需要θi的平方尽可能小,即|θi|尽可能小,而我们知道θ1是偏置,它并没有乘以一个特征,它相当于直线中的截距,而它的绝对值一般会设置的很大,如果θ1设置的太小,决策边界的直线就会接近原点,显然是不合理的
为什么要引入正则化
作用:尽可能防止过拟合现象
原理:如果用阶数过高的多项式去拟合数据,即使这个函数很好的预测到了结果,但是它实际上是过拟合的。因为我们需要让代价函数最小,所以我们在这些高阶的自变量前面加上一个大的系数,让高阶的特征自变量尽可能得接近0,就好像去掉了高阶部分的自变量。
而如果我们特征太多,我们并不知道哪个特征是相关性低的,所以需要将修改成如下的代价函数来缩小每个参数的值

数据集的链接
https://github.com/fengdu78/Coursera-ML-AndrewNg-Notes
