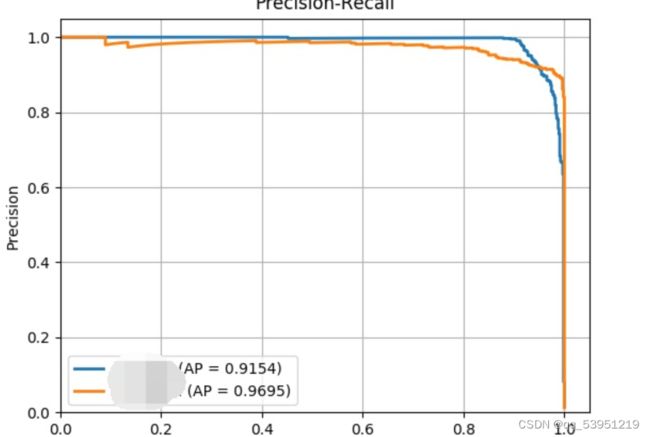
机器学习:目标检测为例,作出Precision-Recall曲线
前言
查重率与查准率
P-R曲线的绘制
ROC曲线的绘制
查准率和查全率
P-R曲线,被称为precision(查准率)和recall(查全率)曲线,以查准率为纵轴,以查全率为横轴,绘制出二维图像
对于二分类问题,我们可以将样例根据其真实类别与学习器预测类别的组合划分为真正例(true positive),假正例(false positive),真反例(true negative),以及假反例(false negative)四种情形,我们也相应的用TP,FP,TN,FN来分别表示其对应的样例的数目,那么这四者相加起来的总和就是样例的总数目。这里我们可以使用混淆矩阵来表示分类结果,使其更加直观:
由图我们可以更加清晰了解这四种情形的含义。
TP:实际是正例预测结果也是正例。
FN:实际是正例,但是预测结果是反例。
FP:实际是反例,但是预测结果是正例。
TN:实际是反例并且预测结果也是反例。
平均精度AP就是P-R曲线下的面积
查全率和查准率就是根据这些数据进行计算,根据《机器学习实战》这本教材上,此书是采取西瓜问题进行介绍,就比如查全率是在一堆西瓜中有多少好瓜,其余则是坏瓜,查全率查出的好瓜中有多少被挑出来了。
则
查准率P的表达式
P=TP/(TP+FP)
查全率R的表达式
R=TP/(TP+FN)
我们可以举个简单的例子,假设有100个西瓜,其中有80个好瓜,20个坏瓜,设置阈值,我们使用分类器预测,其预测60个好瓜,在这60个好瓜中,有50个是真的好瓜,也就是说50个预测正确,10个预测错误,所以
P=50/(50+10)=0.833
R=50/(50+30)=0.625
P-R曲线的绘制
了解了查全率和查准率的相应的概念,我们就可以进行P-R曲线的绘制。我们知道,算法对样本进行分类的时候,都会有置信度,也就是表示该样本为正例的概率。然后通过选取合适的阈值,对样本概率进行划分,比如阈值为50%时,就是其置信度大于50%,那么它就是正例,否则它就是反例。
这里绘制图线同样的道理,我们要产生随机的概率,表示每个样本例子为正例的概率,然后通过这些概率进行从大到小的排序,再按此顺序逐个样本的选择阈值,大于阈值的概率的样例为正例,后面的全部为反例。我们将数据中每个样例的概率作为阈值,然后得到相应的查全率和查准率,这样我们可以许多数据,根据这些数据绘制图线
以一组测试数据为例
def _do_python_eval(self, output_dir = 'output'):
annopath = os.path.join(
self._devkit_path,
'VOC' + self._year,
'Annotations',
'{:s}.xml')
imagesetfile = os.path.join(
self._devkit_path,
'VOC' + self._year,
'ImageSets',
'Main',
self._image_set + '.txt')
cachedir = os.path.join(self._devkit_path, 'annotations_cache')
aps = []
# The PASCAL VOC metric changed in 2010
use_07_metric = True if int(self._year) < 2010 else False
print ('VOC07 metric? ') + ('Yes' if use_07_metric else 'No')
if not os.path.isdir(output_dir):
os.mkdir(output_dir)
for i, cls in enumerate(self._classes):
if cls == '__background__':
continue
filename = self._get_voc_results_file_template().format(cls)
rec, prec, ap = voc_eval(
filename, annopath, imagesetfile, cls, cachedir, ovthresh=0,
use_07_metric=use_07_metric)
aps += [ap]
pl.plot(rec, prec, lw=2,
label='{} (AP = {:.4f})'
''.format(cls, ap))
print('AP for {} = {:.4f}'.format(cls, ap))
with open(os.path.join(output_dir, cls + '_pr.pkl'), 'w') as f:
cPickle.dump({'rec': rec, 'prec': prec, 'ap': ap}, f)
pl.xlabel('Recall')
pl.ylabel('Precision')
plt.grid(True)
pl.ylim([0.0, 1.05])
pl.xlim([0.0, 1.05])
pl.title('Precision-Recall')
pl.legend(loc="lower left")
plt.savefig('./PR.jpg')
plt.show()
print('Mean AP = {:.4f}'.format(np.mean(aps)))
print('~~~~~~~~')
print('Results:')
for ap in aps:
print('{:.3f}'.format(ap))
print('{:.3f}'.format(np.mean(aps)))
print('~~~~~~~~')
print('')
print('--------------------------------------------------------------')
print('Results computed with the **unofficial** Python eval code.')
print('Results should be very close to the official MATLAB eval code.')
print('Recompute with `./tools/reval.py --matlab ...` for your paper.')
print('-- Thanks, The Management')
print('--------------------------------------------------------------')
将整个函数归结在一起了,直接启动运行指令,然后得到运行的P-R曲线
ROC曲线绘制
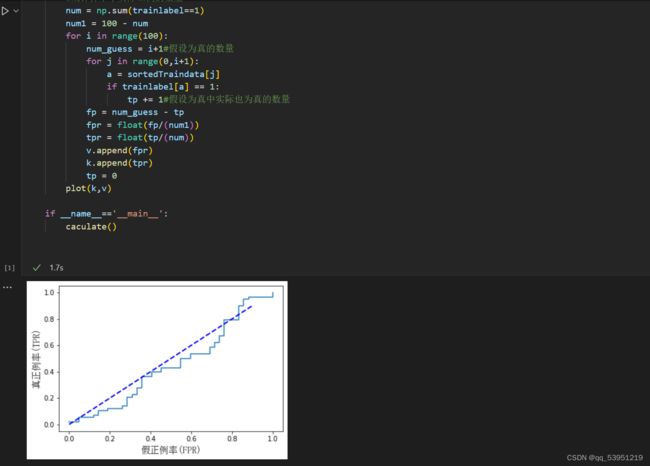
ROC曲线与P-R曲线很类似,我们根据学习器的预测结果对样例进行排序,按此顺序逐个把样本作为正例进行预测,每次计算其横纵坐标的值,就可以得到ROC曲线,但是与P-R曲线的不同是,ROC曲线横轴使用的是“假正例率”,纵轴使用的是“真正例率”,我们同样可以写出它们的计算表达式
真正例率其实和查全率R一样,即
TPR=TP/TP+FN
假正例率
FPR=FP/TN+FP
则可以参考数据画出ROC曲线
import matplotlib.pyplot as plt
import numpy as np
from matplotlib.font_manager import FontPropertiesdef plot(tpr,fpr):#画出函数图像
fig = plt.figure()
font = FontProperties(fname=r"c:\windows\fonts\simsun.ttc", size=14)
plt.xlabel('假正例率(FPR)',fontproperties=font)
plt.ylabel('真正例率(TPR)',fontproperties=font)
x = np.arange(0,1.1,0.2)
y = np.arange(0,1.1,0.2)
plt.xticks(x)
plt.yticks(y)
plt.plot(fpr,tpr)
x1 = np.arange(0, 1.0, 0.1)
plt.plot(x1, x1, color='blue', linewidth=2, linestyle='--')
plt.show()
def caculate():tp = 0
#初始化样本标签,假设1为正例,0为负例
trainlabel = np.random.randint(0,2,size=100)#产生100个概率值(置信度),即单个样本值为正例的概率
traindata = np.random.rand(100)#将样本数据为正例概率从大到小排序返回索引值
sortedTraindata = traindata.argsort()[::-1]k = []
v = []
#统计样本中实际正例的数量
num = np.sum(trainlabel==1)
num1 = 100 - num
for i in range(100):
num_guess = i+1#假设为真的数量
for j in range(0,i+1):
a = sortedTraindata[j]
if trainlabel[a] == 1:
tp += 1#假设为真中实际也为真的数量
fp = num_guess - tp
fpr = float(fp/(num1))
tpr = float(tp/(num))
v.append(fpr)
k.append(tpr)
tp = 0
plot(k,v)if __name__=='__main__':
caculate()
本人也是结合自己的学习经历,希望能对各位看官有帮助
参考博客:http://t.csdn.cn/HyTGi


