[python]线性规划作图及求解
[python]线性规划作图及求解
- 前言
- 一、最优化题目(求最大值)
- 二、求解线性规划
-
- 1.使用fill_between()函数画线性规划
- 2.数值求解
- 三、参考资料
前言
第一次写博客,理论与实践相结合。
一、最优化题目(求最大值)
m a x Z = 70 x 1 + 30 x 2 max\ \ \ Z = 70x_1+30x_2\\ max Z=70x1+30x2
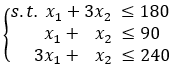
x 1 ≥ 0 , x 2 ≥ 0 x_1 ≥ 0 ,x_2 ≥ 0\\ x1≥0,x2≥0
二、求解线性规划
1.使用fill_between()函数画线性规划
fill_between()函数是填充两条线条之间的区域。但现有3条线,先将其中2条线定义在一个函数中,成为1个线条(两两组合两组,再将这两组组合),再由第3条线约束进行区域的填充。
plt.fill_between(x,0,y7, where=y7<=y3,facecolor=‘grey’, alpha=0.5)
x:第一个参数表示覆盖的区域,我直接复制为x,表示整个x都覆盖
0:表示覆盖的下限
y7:表示覆盖的上限是y7这个曲线
where: 对覆盖区域进行条件判断和约束
facecolor:覆盖区域的颜色
alpha:覆盖区域的透明度[0,1],其值越大,表示越不透明
将2个线条定义为1个,用numpy中的minimum()函数和maximun()函数
代码如下:
import numpy as np
import matplotlib.pyplot as plt
%matplotlib inline

x = np.linspace(0.0,240.0,30)

y1 = -0.33*x + 60
y2 = -1*x + 90
y3 = -3*x + 240

y4 = np.minimum(y1, y2)
y5 = np.minimum(y2, y3)
y7 = np.minimum(y4, y5)

plt.fill_between(x,0,y7, where=y7<=y3,facecolor='grey', alpha=0.5)

plt.plot(x, y1, label=r'$y = -0.33*x+60$')
plt.plot(x, y2, label=r'$y=-1*x+90$')
plt.plot(x, y3, label=r'$y=-3*x+240$')

plt.xlim((0.0, 240.000))
plt.ylim((0.0, 240.000))
plt.xlabel(r'$x$')
plt.ylabel(r'$y$')
plt.legend(bbox_to_anchor=(1.05, 1), loc=2, borderaxespad=0.)
plt.show()
图解如下:
![[python]线性规划作图及求解_第1张图片](http://img.e-com-net.com/image/info8/aa1e46ca0d774563ae17376d8243b994.jpg)
2.数值求解
代码如下(示例):
import numpy as np
from scipy.optimize import linprog

A = np.array([[1, 3], [1, 1], [3, 1]])
b = np.array([180, 90, 240])
c = np.array([-70, -30])

res = linprog(c, A_ub = A, b_ub = b)

print('Optimal value:', round(res.fun * (-1), ndigits = 2),
     '\nx values:', res.x,
     '\nNumber of iterations performed:', res.nit,
     '\nStatus:', res.message)
结果如下:
Optimal value: 5700.0
x values: [74.9999996 14.99999987]
Number of iterations performed: 5
Status: Optimization terminated successfully.
三、参考资料
- https://blog.csdn.net/Poul_henry/article/details/88936637
- https://blog.csdn.net/kabuto_hui/article/details/84979606
- 求解过程参考了一位大佬的文章,现在找不到了,后面找到了补上