5--California House Prices(使用MLP)
目录
5.1 数据集的准备
5.2 数据预处理
5.2 数据处理
5.3 训练
5.4 提交
与示例的那个比赛不同的是,该数据集存在缺失值,并且离散特征较多。如果同示例一样直接对离散值进行热编码,内存会爆炸,所以这里对数据的提前处理比较重要。本来应该先了解特征工程的,这里为了简单直接对复杂特征进行丢弃。
5.1 数据集的准备
同示例一样,有两种方法。由于该数据集不大,所以选择直接下载到本地后上传到google云盘使用。因为之前写过具体步骤,这里就不再写了,附上之前的链接。CSDN
导入数据集,训练数据集包括47439个样本,每个样本40个特征和1个标签, 而测试数据集包含31626个样本,每个样本40个特征。
train_data = pd.read_csv('/content/drive/MyDrive/data/california-house-prices/train.csv')
test_data = pd.read_csv('/content/drive/MyDrive/data/california-house-prices/test.csv')
print(train_data.shape)
print(test_data.shape)

#输出
(47439, 41)
(31626, 40)
5.2 数据预处理
查看具体的特征有哪些,其中‘Id'列跟预测结果没有关系,将其删除。训练数据中的’Sold Price‘是标签,也需要删除,其他的Adress和Summary由于太复杂了,这里也直接删除。
train_data.columns
test_data.columns
#输出:
Index(['Id', 'Address', 'Sold Price', 'Summary', 'Type', 'Year built',
       'Heating', 'Cooling', 'Parking', 'Lot', 'Bedrooms', 'Bathrooms',
       'Full bathrooms', 'Total interior livable area', 'Total spaces',
       'Garage spaces', 'Region', 'Elementary School',
       'Elementary School Score', 'Elementary School Distance',
       'Middle School', 'Middle School Score', 'Middle School Distance',
       'High School', 'High School Score', 'High School Distance', 'Flooring',
       'Heating features', 'Cooling features', 'Appliances included',
       'Laundry features', 'Parking features', 'Tax assessed value',
       'Annual tax amount', 'Listed On', 'Listed Price', 'Last Sold On',
       'Last Sold Price', 'City', 'Zip', 'State'],
      dtype='object')
Index(['Id', 'Address', 'Summary', 'Type', 'Year built', 'Heating', 'Cooling',
       'Parking', 'Lot', 'Bedrooms', 'Bathrooms', 'Full bathrooms',
       'Total interior livable area', 'Total spaces', 'Garage spaces',
       'Region', 'Elementary School', 'Elementary School Score',
       'Elementary School Distance', 'Middle School', 'Middle School Score',
       'Middle School Distance', 'High School', 'High School Score',
       'High School Distance', 'Flooring', 'Heating features',
       'Cooling features', 'Appliances included', 'Laundry features',
       'Parking features', 'Tax assessed value', 'Annual tax amount',
       'Listed On', 'Listed Price', 'Last Sold On', 'Last Sold Price', 'City',
       'Zip', 'State'],
      dtype='object')
将上诉列进行删除后,可以看见现在特征数还有36个。
all_features = pd.concat((train_data.iloc[:,4:-1],test_data.iloc[:,3:-1]))
all_features.shape

#输出结果:
(79065, 36)
5.2 数据处理
首先处理缺失值,查看哪些特征存在缺失值。
miss_values_count = all_features.isnull().sum()
miss_values_count.loc[miss_values_count>0]

#输出结果:
Year built                      1942
Heating                        11513
Cooling                        15109
Parking                         1676
Lot                            22989
Bedrooms                        4598
Bathrooms                       5410
Full bathrooms                 12928
Total interior livable area     3878
Total spaces                    1667
Garage spaces                   1667
Region                             2
Elementary School               8493
Elementary School Score         8735
Elementary School Distance      8493
Middle School                  28277
Middle School Score            28279
Middle School Distance         28277
High School                     7174
High School Score               7784
High School Distance            7175
Flooring                       21927
Heating features               12548
Cooling features               16633
Appliances included            23349
Laundry features               19982
Parking features                6628
Tax assessed value              6323
Annual tax amount               7209
Last Sold On                   29545
Last Sold Price                29545
将缺失值同一列后一行的值赋值给缺失值,对于没有后一行的值用“0”填充
all_features = all_features.fillna(method='bfill',axis=0).fillna(0)对日期数据进行处理,这里好像不处理也可以:
all_features['Listed On'] = pd.to_datetime(all_features['Listed On'],format = "%Y-%m-%d")
all_features['Last Sold On'] = pd.to_datetime(all_features['Last Sold On'],format = "%Y-%m-%d")
对数据进行标准化
numeric_features = all_features.dtypes[all_features.dtypes == 'float64'].index
all_features[numeric_features] = all_features[numeric_features].apply(
    lambda x: (x-x.mean()) / (x.std())
)
# 在标准化数据之后,所有均值消失,将缺失值设置为0
all_features[numeric_features] = all_features[numeric_features].fillna(0)
对离散值进行独立热编码,这里不能直接对所有的离散值进行独立热编码,会导致内存爆炸。现对离散值的情况进行查看,发现这些也太多了吧!
all_features.dtypes[all_features.dtypes=='object']
for feature in all_features.dtypes[all_features.dtypes=='object'].keys():
  print(feature,len(all_features[feature].unique()))
我太菜了,不会处理这么多,就只留下了数量最少的’Type‘特征,其他的都扔掉。
features = list(numeric_features)
features.append('Type')
all_features = all_features[features]
all_features = pd.get_dummies(all_features,dummy_na=True)
all_features.shape#这里的列数变多了 因为离散值的每一列都会变成很多列 每个数值为true的情况

#输出:
(79065, 192)
处理后,转为张量,方便后续的运算。
n_train = train_data.shape[0]#得到训练数据的个数
train_features = torch.tensor(all_features[:n_train].values,dtype=torch.float32)
test_features = torch.tensor(all_features[n_train:].values,dtype=torch.float32)
train_labels = torch.tensor(train_data['Sold Price'].values.reshape(-1,1),dtype=torch.float32)
5.3 训练
这里就同示例一致了,不过我这里定义的net与示例不同。
loss = nn.MSELoss()
in_features = train_features.shape[1]

def get_net():
  net = nn.Sequential(nn.Linear(in_features,256),nn.ReLU(),nn.Dropout(),nn.Linear(256,64),
                    nn.ReLU(),nn.Linear(64,1))
  return net

def log_rmse(net,features,labels):
  clipped_preds = torch.clamp(net(features),1,float('inf'))
  rmse = torch.sqrt(loss(torch.log(clipped_preds),torch.log(labels)))
  return rmse.item()

def train(net,train_features,train_labels,test_features,test_labels,num_epochs,lr,weight_decay,batch_size):
  train_ls,test_ls = [],[]
  train_iter = d2l.load_array((train_features,train_labels),batch_size)
  # 这里使用的是Adam优化算法
  optimizer = torch.optim.Adam(net.parameters(),lr=lr,weight_decay=weight_decay)
  for epoch in range(num_epochs):
    for X, y in train_iter:
      optimizer.zero_grad()
      l = loss(net(X),y)
      l.backward()
      optimizer.step()
    train_ls.append(log_rmse(net,train_features,train_labels))
    if test_labels is not None:
      test_ls.append(log_rmse(net,test_features,test_labels))
  return train_ls, test_ls

def get_k_fold_data(k, i, X, y):
    assert k > 1
    fold_size = X.shape[0] // k
    X_train, y_train = None, None
    for j in range(k):
        idx = slice(j * fold_size, (j + 1) * fold_size)
        X_part, y_part = X[idx, :], y[idx]
        if j == i:
            X_valid, y_valid = X_part, y_part
        elif X_train is None:
            X_train, y_train = X_part, y_part
        else:
            X_train = torch.cat([X_train, X_part], 0)
            y_train = torch.cat([y_train, y_part], 0)
    return X_train, y_train, X_valid, y_valid

def k_fold(k, X_train, y_train, num_epochs, learning_rate, weight_decay,
           batch_size):
    train_l_sum, valid_l_sum = 0, 0
    for i in range(k):
        data = get_k_fold_data(k, i, X_train, y_train)
        net = get_net()
        train_ls, valid_ls = train(net, *data, num_epochs, learning_rate,
                                   weight_decay, batch_size)
        train_l_sum += train_ls[-1]
        valid_l_sum += valid_ls[-1]
        if i == 0:
            d2l.plot(list(range(1, num_epochs + 1)), [train_ls, valid_ls],
                     xlabel='epoch', ylabel='rmse', xlim=[1, num_epochs],
                     legend=['train', 'valid'], yscale='log')
        print(f'折{i + 1},训练log rmse{float(train_ls[-1]):f}, '
              f'验证log rmse{float(valid_ls[-1]):f}')
    return train_l_sum / k, valid_l_sum / k

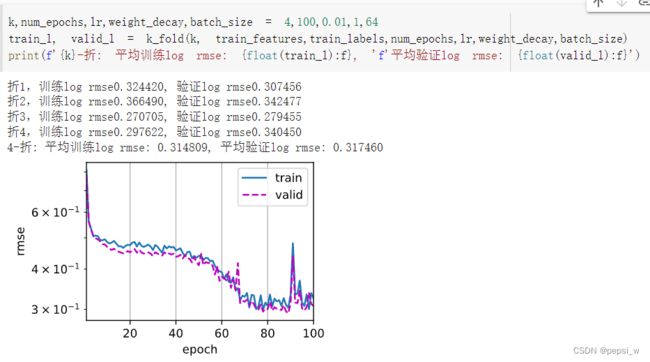
k,num_epochs,lr,weight_decay,batch_size = 4,70,0.01,1,64
train_l, valid_l = k_fold(k, train_features,train_labels,num_epochs,lr,weight_decay,batch_size)
print(f'{k}-折: 平均训练log rmse: {float(train_l):f}, 'f'平均验证log rmse: {float(valid_l):f}')

k,num_epochs,lr,weight_decay,batch_size = 4,100,0.01,2,64
train_l, valid_l = k_fold(k, train_features,train_labels,num_epochs,lr,weight_decay,batch_size)
print(f'{k}-折: 平均训练log rmse: {float(train_l):f}, 'f'平均验证log rmse: {float(valid_l):f}')
运行结果:
5.4 提交
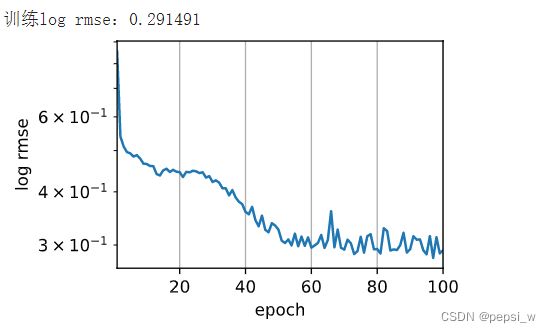
def train_and_pred(train_features, test_features, train_labels, test_data,num_epochs, lr, weight_decay, batch_size):
    net = get_net()
    train_ls, _ = train(net, train_features, train_labels, None, None,
                        num_epochs, lr, weight_decay, batch_size)
    d2l.plot(np.arange(1, num_epochs + 1), [train_ls], xlabel='epoch',
             ylabel='log rmse', xlim=[1, num_epochs], yscale='log')
    print(f'训练log rmse:{float(train_ls[-1]):f}')
    # 将网络应用于测试集。
    preds = net(test_features).detach().numpy()
    # 将其重新格式化以导出到Kaggle
    test_data['Sold Price'] = pd.Series(preds.reshape(1, -1)[0])
    submission = pd.concat([test_data['Id'], test_data['SalePrice']], axis=1)
    submission.to_csv('submission.csv', index=False)

k,num_epochs,lr,weight_decay,batch_size = 4,100,0.01,1,64
train_and_pred(train_features, test_features, train_labels, test_data,
               num_epochs, lr, weight_decay, batch_size)
运行结果:

