【学习记录】python感知机实现鸢尾花分类
可以用 jupyter notebook 运行
感知机代码:
代码解析
import numpy as np

class Perceptron(object):
    def __init__(self, eta=0.01, n_iter=50, random_state=1):
        self.eta = eta
        self.n_iter = n_iter
        self.random_state = random_state

    def fit(self, X, y):
        rgen = np.random.RandomState(self.random_state)
        self.w_ = rgen.normal(loc=0.0, scale=0.01, size=1 + X.shape[1])
        self.errors_ = []

        for _ in range(self.n_iter):
            errors = 0
            for xi, target in zip(X, y):
                update = self.eta * (target - self.predict(xi))
                self.w_[1:] += update * xi
                self.w_[0] += update
                errors += int(update != 0.0)
            self.errors_.append(errors)
        return self

    def net_input(self, X):
        """Calculate net input"""
        return np.dot(X, self.w_[1:]) + self.w_[0]

    def predict(self, X):
        """Return class label after unit step"""
        return np.where(self.net_input(X) >= 0.0, 1, -1)
对鸢尾花分类
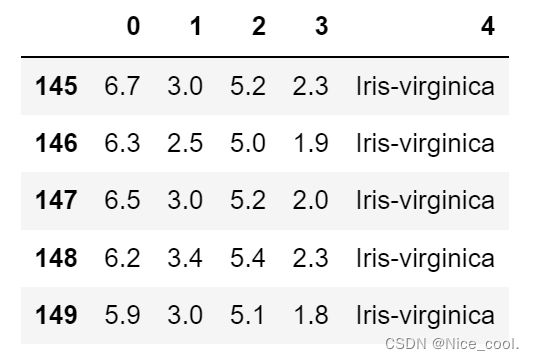
1)用pandas加载鸢尾花数据集到DataFrame对象,再用tail方法把最后五行数据列出来以确保加载的正确性
import os
import pandas as pd
df = pd.read_csv('your/local/path/to/ifis.data',
                 header=None,
                 encoding='utf-8')

df.tail()

2)
(i)
提取与 50朵山鸢尾花 和 50朵变色鸢尾花相对应的前100个分类标签,
并将其转换为整数型标签1和-1,
并存入向量y,
再通过调用pandas的DataFrame的value方法获取相应的numpy表达式
(ii)
从100个训练样本中提取特征的第一列和第三列,并存入特征矩阵X
%matplotlib inline
import matplotlib.pyplot as plt
import numpy as np

# select setosa and versicolor
y = df.iloc[0:100, 4].values
y = np.where(y == 'Iris-setosa', -1, 1)

# extract sepal length and petal length
X = df.iloc[0:100, [0, 2]].values
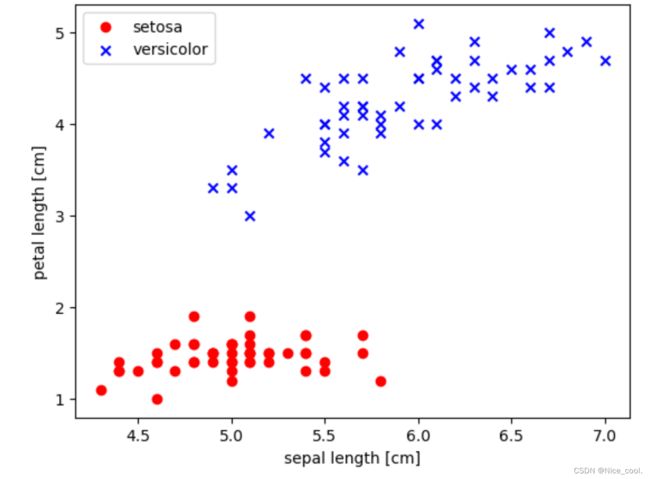
3)绘制二维散点图
# plot data
plt.scatter(X[:50, 0], X[:50, 1],
            color='red', marker='o', label='setosa')
plt.scatter(X[50:100, 0], X[50:100, 1],
            color='blue', marker='x', label='versicolor')

plt.xlabel('sepal length [cm]')
plt.ylabel('petal length [cm]')
plt.legend(loc='upper left')

plt.show()

从数据分布看,像感知机这样的线性分类器能够完美的对上述数据分类
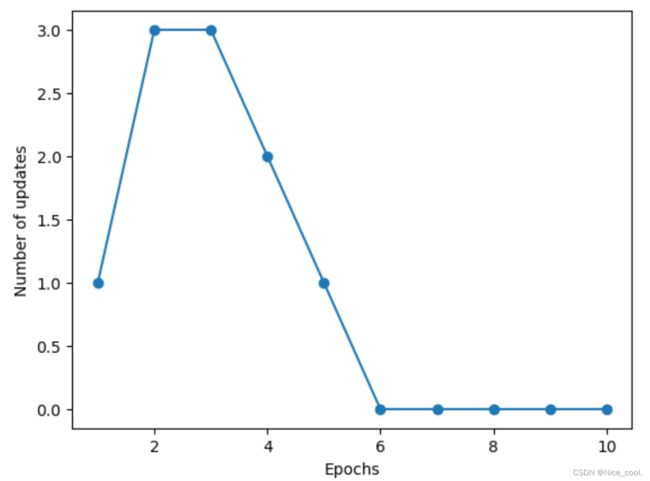
4)Training the perceptron model
ppn = Perceptron(eta=0.1, n_iter=10)

ppn.fit(X, y)

plt.plot(range(1, len(ppn.errors_) + 1), ppn.errors_, marker='o')
plt.xlabel('Epochs')
plt.ylabel('Number of updates')

plt.show()
二维数据集决策边界的可视化
说明:
(i)可以通过ListedColormap 根据颜色列表来定义和创建色度图
(ii)确定两个特征的最大值和最小值
(iii)利用numpy的meshgrid,利用特征向量来创建网格数组对 xx1 和 xx2
(iiii)因为在两个特征维度上训练,所以要对网格数组进行扁平化
(iiiii)通过predict预测相应网络点的分类标签z
from matplotlib.colors import ListedColormap


def plot_decision_regions(X, y, classifier, resolution=0.02):

    # setup marker generator and color map
    markers = ('s', 'x', 'o', '^', 'v')
    colors = ('red', 'blue', 'lightgreen', 'gray', 'cyan')
    cmap = ListedColormap(colors[:len(np.unique(y))])

    # plot the decision surface
    x1_min, x1_max = X[:, 0].min() - 1, X[:, 0].max() + 1
    x2_min, x2_max = X[:, 1].min() - 1, X[:, 1].max() + 1
    xx1, xx2 = np.meshgrid(np.arange(x1_min, x1_max, resolution),
                           np.arange(x2_min, x2_max, resolution))
    Z = classifier.predict(np.array([xx1.ravel(), xx2.ravel()]).T)
    Z = Z.reshape(xx1.shape)
    plt.contourf(xx1, xx2, Z, alpha=0.3, cmap=cmap)
    plt.xlim(xx1.min(), xx1.max())
    plt.ylim(xx2.min(), xx2.max())

    # plot class examples
    for idx, cl in enumerate(np.unique(y)):
        plt.scatter(x=X[y == cl, 0],
                    y=X[y == cl, 1],
                    alpha=0.8,
                    c=colors[idx],
                    marker=markers[idx],
                    label=cl,
                    edgecolor='black')
plot_decision_regions(X, y, classifier=ppn)
plt.xlabel('sepal length [cm]')
plt.ylabel('petal length [cm]')
plt.legend(loc='upper left')

plt.show()

