吴恩达机器学习python实现1 单变量线性回归
单变量线性回归
0、引入要用到的库
import numpy as np
import matplotlib.pyplot as plt
1、读取数据,绘制图像
with open(文件路径) as f:
    populations = []
    profit = []
    for line in f.readlines():
        populations.append(float(line.split(',')[0]))
        profit.append(float(line.split(',')[1].split('\n')[0]))
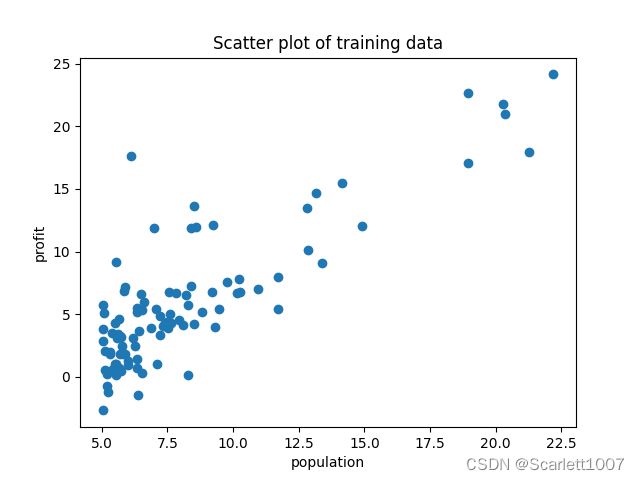
plt.title("Scatter plot of training data")
plt.xlabel("population")
plt.ylabel("profit")
plt.scatter(populations, profit, marker="o")
plt.show()
得到如下图像:
2、梯度下降
m = len(populations)
alpha = 0.01
iterations = 1500
theta = [0, 0]
theta0 = []
theta1 = []
c = 0
cost = []
t = []
# theta为[0,0]时代价函数的值
for j in range(m):
    c += 1/(2*m)*pow(theta[0]+theta[1]*populations[j]-profit[j], 2)
# 梯度下降
for i in range(iterations):
    t.append(i)
    # 更新theta值
    tmp0, tmp1 = theta[0], theta[1]
    for j in range(m):
        theta[0] -= alpha * (1/m) * (tmp0+tmp1*populations[j]-profit[j])
        theta[1] -= alpha * (1/m) * (tmp0+tmp1*populations[j]-profit[j]) * populations[j]
    theta0.append(theta[0])
    theta1.append(theta[1])
    # 计算代价函数
    c = 0
    for j in range(m):
        c += 1 / (2 * m) * pow(theta[0] + theta[1] * populations[j] - profit[j], 2)
    cost.append(c)
3、画图验证
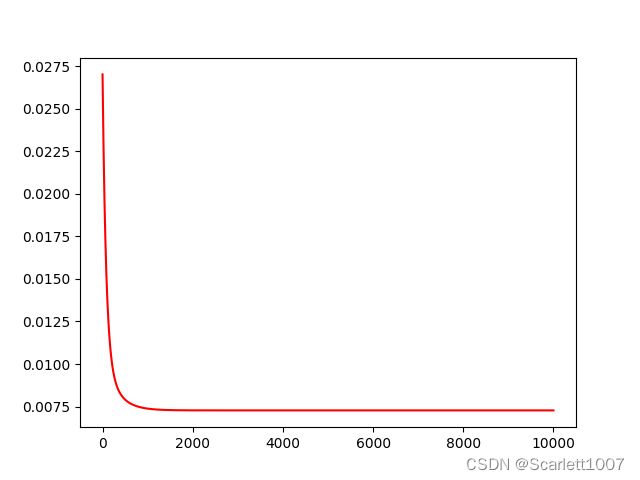
# 画图验证代价曲线
plt.plot(t, cost, c='r')
plt.show()
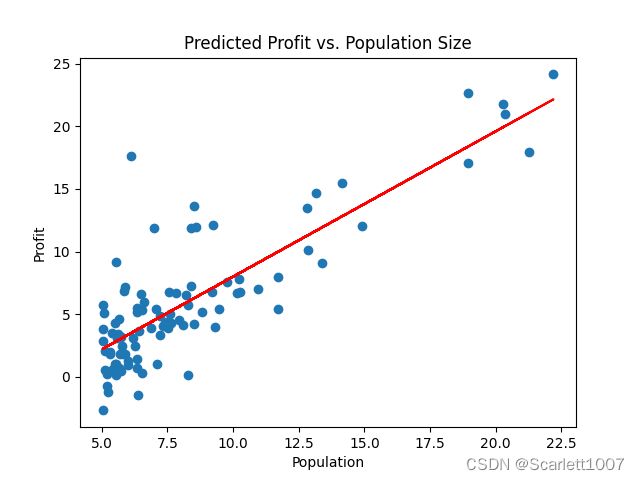
# 画图验证拟合情况
x = populations
y = [-3.6+1.16*float(x1) for x1 in x]
fig, ax = plt.subplots()
ax.plot(x, y, 'r', label='prediction')
ax.scatter(populations, profit, marker="o", label='Data')
ax.set_xlabel('Population')
ax.set_ylabel('Profit')
ax.set_title('Predicted Profit vs. Population Size')
plt.show()4、正规方程求解theta
Y = np.mat(profit)
Y = np.transpose(Y)
X1 = np.mat(populations)
X1 = np.transpose(X1)
X2 = np.ones((len(populations), 1))
X = np.hstack((X2, X1))
theta = ((( X.T ) * X).I)*(X.T)*Y
print(theta)
求得theta值 -3.89578088 1.19303364
多变量线性回归
1、读取数据
houseSize = []
bedroomNumber = []
housePrice = []
with open(文件路径, "r") as f:
    for line in f.readlines():
        col1 = float(line.split(",")[0])
        col2 = float(line.split(",")[1])
        col3 = float(line.split(",")[2].split("\n")[0])
        houseSize.append(col1)
        bedroomNumber.append(col2)
        housePrice.append(col3)
2、特征归一化
x1 = np.array(houseSize).reshape(-1, 1)  # 指定数组列为1
x2 = np.array(bedroomNumber).reshape(-1, 1)
y = np.array(housePrice).reshape(-1, 1)
data = np.concatenate((x1, x2, y), axis=1)
print(data.shape)
mean = np.mean(data, axis=0)  # 计算每一列均值
ptp = np.ptp(data, axis=0)  # 计算每一列最大值最小值之差
nor_data = (data-mean)/ptp
y = nor_data[..., -1] # 等价于y1 = nor_data[:, -1]
X = np.insert(nor_data[..., :2], 0, 1, axis=1)
3、梯度下降
# 代价函数
def cost(X, y, theta):
    m = X.shape[0]  # 矩阵的行数
    temp = X.dot(theta)-y
    return (temp.T).dot(temp)/(2*m)

# 梯度下降
def gradient_descent(X, y, theta, alpha, iterations):
    m = X.shape[0]
    c = []
    for i in range(iterations):
        theta -= (alpha/m)*X.T.dot(X.dot(theta)-y)
        c.append(cost(X, y, theta))
    return theta, c

# 正规方程
def normal_equation(X, y):
    return np.linalg.pinv(X.T.dot(X)).dot(X.T).dot(y)
选取参数,求得theta
alpha = 0.1
iterations = 10000
theta = np.zeros((3,))
theta, c = gradient_descent(X, y, theta, alpha, iterations)
print(theta)
# print(c)
theta2 = normal_equation(X,y)
print(theta2)
4、画图验证
plt.plot([i for i in range(iterations)],c,'r')
plt.show()


