机器学习 建立模型
The web is already flooded by data science and machine learning related resources nowadays. There are numerous blogs, websites, YouTube videos, and forums that are providing useful information regarding data science related topics. Now it has become tedious to choose the right material for any data science quest.
如今,网络已经充斥着与数据科学和机器学习相关的资源。 有许多博客,网站,YouTube视频和论坛提供有关数据科学相关主题的有用信息。 现在,为任何数据科学探索选择合适的材料已经变得很繁琐。
When I started my journey in data science, a few years back, I faced the same dilemma. But one thing I observed in most of these resources they are not complete. You have to traverse through a number of resources to get exhaustive information.
几年前,当我开始数据科学之旅时,我面临着同样的困境。 但是我在大多数这些资源中观察到的一件事是它们并不完整。 您必须遍历大量资源才能获取详尽的信息。
Also, I saw a lack of real-life perspective of the articles written on machine learning models. So I thought of writing a post on the overall picture of building a machine learning model for any use case in real-life.
此外,我看到关于机器学习模型的文章缺乏现实生活的视角。 因此,我想写一篇关于为现实生活中的任何用例构建机器学习模型的整体文章。
To perform any data science project, a data scientist needs to go through several steps. Broadly these steps can be presented as:
要执行任何数据科学项目,数据科学家需要经历几个步骤。 这些步骤可以大致表示为:
- Formulation of the data science problem from the given business problem 根据给定的业务问题制定数据科学问题
2. Data source exploration and data collection
2.数据源探索和数据收集
3. Exploration of the variables (EDA)
3.探索变量(EDA)
4. Model building
4.建立模型
5. Model evaluation
5.模型评估
6. Model deployment
6.模型部署
Steps 1 and 2 depend on the context of the problem. Step 6 depends more on the business requirement and the available infrastructure. And steps 2, 3, 4, and 5 are the sole responsibilities of a data scientist.
步骤1和2取决于问题的背景。 步骤6取决于业务需求和可用的基础结构。 步骤2、3、4和5是数据科学家的唯一责任。
In this post, I shall discuss how to build a classification model end-to-end. I shall take you through the entire journey of a data scientist in any project that requires building a classification model. I shall try to organize this post in such a way that it can be readily adapted for similar situations.
在本文中,我将讨论如何端到端构建分类模型。 在需要建立分类模型的任何项目中,我将带您经历数据科学家的整个旅程。 我将尝试以易于适应类似情况的方式来组织此职位。
I used a Random Forst model to describe the methods. Even if you use any other classifier, the execution will be pretty similar.
我使用随机Forst模型来描述这些方法。 即使您使用任何其他分类器,其执行过程也将非常相似。
1.根据给定的业务问题制定科学问题 (1. Formulation of a science problem from a given business problem)
Usually, data science problems arise from business requirements. Business executives face various challenges in their process related to — product sales, profit margin, customer loyalty, procurement decisions, market share, and many other areas.
通常,数据科学问题源于业务需求。 企业高管在其流程中面临与产品销售,利润率,客户忠诚度,采购决策,市场份额以及许多其他领域相关的各种挑战。
These business problems will come to you as few business questions or as some observations by the business executives which they would like to verify.
这些业务问题将给您带来尽可能少的业务问题或他们想证实的业务主管的观察。
As a data scientist, it is your duty to convert those business problems into a data science problem and provide the answers meaningfully.
作为数据科学家,您有责任将这些业务问题转换为数据科学问题并有意义地提供答案。
In this post, I shall consider a simple problem of social network advertisement. The data set provides some variables that indicate the profiles of the customers. Also, it indicates the customers who have purchased the product.
在这篇文章中,我将考虑一个简单的社交网络广告问题。 数据集提供了一些指示客户概况的变量。 另外,它指示购买产品的客户。
The aim of this assignment will be, based on the customer information, to predict who will purchase the product in the future.
这项任务的目的是根据客户信息,预测谁将在将来购买产品。
So, as a data scientist, you need to understand that it is a classification problem with two classes — purchased and not-purchased.
因此,作为数据科学家,您需要了解这是两个类别的分类问题-已购买和未购买。
2.数据源探索和数据收集 (2. Data source exploration and data collection)
In real-life, data source exploration and data collection isn’t a simple task. In any organization, you will hardly find a single source where you will find all of your required data. Usually, you will find multiple disconnected sources of data and some of them will be hard to access because of infrastructure-related issues or because of restricted access.
在现实生活中,数据源探索和数据收集并不是一件容易的事。 在任何组织中,您几乎都找不到一个可以找到所有所需数据的来源。 通常,您会发现多个断开连接的数据源,并且其中一些由于基础结构相关的问题或访问受到限制而难以访问。
Data collection from external sources also can be tricky because of cost issues and technical challenges.
由于成本问题和技术挑战,从外部来源收集数据也可能很棘手。
In this post, I have limited scope to demonstrate these issues. The data set for this discussion ‘social-network-ads’ is downloaded from here.
在这篇文章中,我将只限于展示这些问题。 可从此处下载此讨论“ social-network-ads”的数据集。
3.探索变量(EDA) (3. Exploration of the variables (EDA))
Before jumping into Exploratory Data Analysis (EDA) you should always take a first look at the data. You should check few things — data volume, nature of different data coming from various sources, compatibility of the data sets, the mapping between them, data quality, data consistency — and most importantly the meaning of each variable and their business implications.
在进入探索性数据分析(EDA)之前,您应该始终首先查看数据。 您应该检查几件事-数据量,来自各种来源的不同数据的性质,数据集的兼容性,它们之间的映射,数据质量,数据一致性-以及最重要的是每个变量的含义及其业务含义。
Now it’s time to get the hands dirty with python codes using “social-network-ads” data. Since I have used single data set to keep this discussion simple, I have limited scope to illustrate all the aspects of the first look at the data I mentioned here.
现在是时候使用“ social-network-ads”数据来处理python代码了。 由于我使用单个数据集来简化讨论,因此我在有限的范围内无法说明我在这里提到的数据的所有外观。
The whole code can be executed in a jupyter notebook or any other python IDE of your choice. We will require several python libraries to complete this classification exercise. I shall first mention all the packages we need.
整个代码可以在jupyter笔记本或您选择的任何其他python IDE中执行。 我们将需要几个python库来完成此分类练习。 我首先要提到我们需要的所有包装。

It is always a good idea to check your current working directory. If required change it to your preferred one.
检查您当前的工作目录总是一个好主意。 如果需要,将其更改为您的首选。

首先看一下数据 (First look at the data)
Have a first look at your data that will be used to build the model. You will know how many variables you are dealing with and what those variables represent.
首先查看将用于构建模型的数据。 您将知道要处理多少个变量以及这些变量代表什么。

This is a small data set with only four hundred observations and five variables. Out of them, the “User ID” will not contribute to model development.
这是一个只有400个观测值和5个变量的小型数据集。 其中,“用户ID”将不会有助于模型开发。
You should check for blank spaces in variable names. If you find any such cases, change the variable names. Blank spaces in variable names cause problems in the scripts. In this data, “User ID” had a blank space, and I changed it to “UserID”.
您应该检查变量名中是否有空格。 如果发现任何此类情况,请更改变量名称。 变量名称中的空格会在脚本中引起问题。 在此数据中,“用户ID”有一个空格,我将其更改为“用户ID”。
变量的数据类型 (The data types of the variables)
Check the data type of each variable you are working with. The most common issues that arise in any data is with the date variable. I saw most of the time the date variables become “object” data type. Make sure you have converted it to date format. My current data does not contain any date-variable. Also, sometimes numerical variables become “object” types when some of their values contain characters or if some of them have missing values.
检查正在使用的每个变量的数据类型。 任何数据中最常见的问题是日期变量。 我大部分时间都看到日期变量变为“对象”数据类型。 确保已将其转换为日期格式。 我当前的数据不包含任何日期变量。 同样,有时当数字变量的某些值包含字符或某些字符缺少值时,它们也会变成“对象”类型。
将数据分为训练,验证和测试集 (Splitting the data into train, validation, and test set)
Before you process your data, split it into train, validation, and test set. Your model should only see the train set to train itself. The validation set should be only used to tune the parameters of the model by checking its performance on the validation set. The test set is used to check the performance of the model on the unseen data.
在处理数据之前,请将其分为训练,验证和测试集。 您的模型应该只看到设置为自行训练的火车。 验证集只能用于通过检查模型在验证集上的性能来调整模型的参数。 测试集用于检查看不见的数据上模型的性能。
All the statistical techniques you will use to process your train set should be used to process the validation and the test set. Also, the values of the statistics, you have estimated from the train set, should be used for the validation set and the test set.
您将用于处理训练集的所有统计技术都应用于处理验证和测试集。 同样,您从训练集估计的统计值也应用于验证集和测试集。
For example, if you have normalized a variable X of the train set by mean m and standard deviation s, the same values should be used to normalize X in the validation set and the test set.
例如,如果您用均值m归一化了火车组的变量X 和标准差s ,应使用相同的值对验证集和测试集中的X进行归一化。
Now, the size of the train, validation, and test set depends on the available data volume. 80–10–10 or 70–20–10 are commonly used percentages of splitting train, validation, and test set when the data set is not large. But, if you have enough data, like millions, then keeping 2% or 1% or even 0.5% is good enough for the validation or test set.
现在,训练,验证和测试集的大小取决于可用的数据量。 当数据集不大时,通常使用80–10–10或70–20–10的分割列,验证和测试集的百分比。 但是,如果您有足够的数据(例如数百万),那么对于验证或测试集而言,保留2%或1%甚至0.5%的数据就足够了。

From this data, I created a train set by taking 80% of the data. Kept 15% for the validation set and 5% for the test set.
根据这些数据,我通过提取80%的数据创建了一个火车集合。 保留15%的验证集和5%的测试集。
变量的分布 (Distribution of the variables)
Now it’s time to explore the train set and to understand the variables in hand.
现在是时候探索列车设置并了解手中的变量了。
A summary statistics of the variables will be helpful to understand their nature. You will have a rough idea about their distributions like — the range, whether they are skewed in nature, frequently appeared categories, etc.
变量的摘要统计将有助于理解变量的性质。 您将对它们的分布情况有一个大概的了解-范围,它们是否自然扭曲,经常出现的类别等。
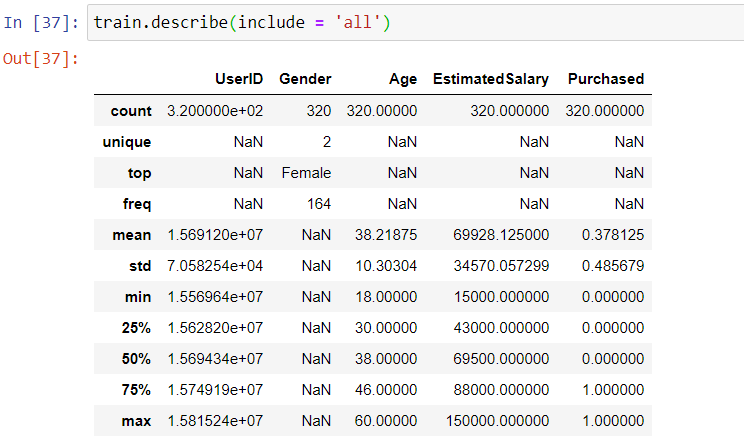
In this data, the gender distribution is dominated by the females. The customer’s ages vary from 18 to 60 with an average of 38.
在此数据中,性别分布由女性主导。 客户的年龄从18岁到60岁不等,平均年龄为38岁。
Visualizations always help in understanding variables in greater depth.
可视化始终有助于更深入地了解变量。
A significant amount of customers are aged around 40. A large segment of customers falls in the lower salary buckets. As expected, the number of customers purchased in much lower than the total number of customers.
大量的客户年龄在40岁左右。很大一部分客户属于低薪阶层。 不出所料,购买的客户数量大大低于客户总数。
Checking the extent of the class imbalance is always a good idea for classification problems.
对于分类问题,检查类不平衡的程度始终是一个好主意。

In the train set, the ratio of purchased vs not-purchased is 38:62. So, the class imbalance is not that significant here.
在火车中,已购买与未购买的比率为38:62。 因此,班级失衡在这里并不是那么重要。
缺失值和离群值 (Missing values and outliers)
Missing values is a sure (almost) phenomenon in real-file data. There are various techniques to deal with missing data — imputation by mean or median for a numeric variable, imputation by mode for a categorical variable, K- Nearest-Neighbors (KNN), regression, etc. Each of them works depending on the context.
在实文件数据中,缺少值是肯定的(几乎)现象。 有多种技术可以处理丢失的数据-数字变量的均值或中位数插值,分类变量的模态插值,K最近邻(KNN),回归等。每种方法都取决于上下文。
In the current industry scenario, if some variable is present in your data, there can be two situations. Either you will have enough values of the variable or there will be no values at all. I hardly see a scenario in between.
在当前的行业情况下,如果您的数据中存在某些变量,则可能有两种情况。 您将拥有足够的变量值,或者根本没有任何值。 我几乎看不到两者之间的情况。
There are reasons for it. Organizations understood the importance of building processes and infrastructure to store data from different business operations. If they find some information crucial and there is a way to record it, they will store it properly. You will get enough information about it. But sometimes it becomes difficult to record a particular kind of information because of human bias or because of technical challenges. In this case, you will hardly get any information.
这是有原因的。 组织了解构建流程和基础结构以存储来自不同业务运营的数据的重要性。 如果他们发现一些关键信息并且有记录的方法,他们将正确地存储它们。 您将获得足够的信息。 但是有时由于人为偏见或技术挑战而难以记录特定类型的信息。 在这种情况下,您几乎不会获得任何信息。
So, I personally try out the deletion of missing values if I have enough data. If a variable has a significant amount of missing values, then dropping the variable may be a good idea. I only try imputation techniques when it is absolutely necessary.
因此,如果我有足够的数据,我个人会尝试删除缺失值。 如果变量具有大量缺失值,则删除该变量可能是一个好主意。 我仅在绝对必要时尝试插补技术。
Another frequently observed characteristic of real-life data is the presence of outliers. You can use upper and lower whiskers to determine outliers. Sometimes people treat lower 2.5 percent and upper 2.5 percent data as outliers. You need to check if they are really outliers before taking any action on them.
现实生活数据的另一个经常观察到的特征是异常值的存在。 您可以使用上下晶须来确定离群值。 有时人们将较低的2.5%和较高的2.5%数据视为异常值。 在对它们采取任何措施之前,您需要检查它们是否真的是离群值。
You can cap the outliers with some estimated upper and lower boundaries from the variables.
您可以使用变量的一些估计上限和下限来限制异常值。
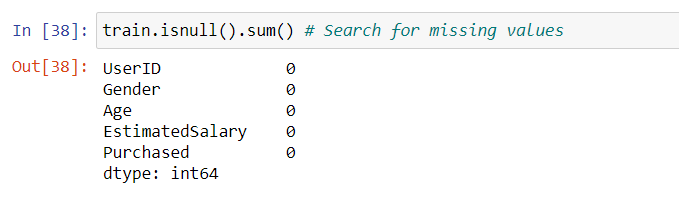
In this data set, there are no missing values. As the response variable in this data is categorical in nature, the concept of outliers is not suitable here.
在此数据集中,没有缺失值。 由于此数据中的响应变量本质上是分类的,因此异常值的概念在此处不适用。
功能创建 (Feature creation)
For most machine learning problems feature creation is a mandatory exercise. Sometimes the data available for model building does not contain enough variables. The available variables may not have sufficient explanatory power to boost the capability of the model. The data we are dealing with has only three variables — age, salary, and gender.
对于大多数机器学习问题,功能创建是一项强制性的练习。 有时,可用于模型构建的数据没有足够的变量。 可用变量可能没有足够的解释能力来增强模型的功能。 我们处理的数据只有三个变量-年龄,薪水和性别。
From these three variables, it will be difficult to build a model that will have enough predictive power. There may exist certain other factors that influence purchase decisions. Now, as we don’t have other information about the customers, we can use these variables judiciously to extract maximum possible explanatory power. For this, we need to create new variables (features) from the existing ones.
从这三个变量中,将很难建立一个具有足够预测能力的模型。 可能存在某些其他因素会影响购买决策。 现在,由于我们没有关于客户的其他信息,因此可以明智地使用这些变量来提取最大可能的解释力。 为此,我们需要从现有变量中创建新变量(功能)。
There may exist another situation where we will have enough variables, but none of them showing adequate explanatory power. In that case, we need to create additional features form the original variables. Also, we may need to combine some variables intelligently to create new ones.
可能存在另一种情况,我们将拥有足够的变量,但是没有一个变量显示出足够的解释力。 在这种情况下,我们需要从原始变量创建其他功能。 另外,我们可能需要智能地组合一些变量以创建新变量。


Here, customers are aged between 18 to 60. Instead of using age as variables, if we can identify the age buckets in which customers have different purchase pattern, it will have more explanatory power in determining whether a customer is going to purchase. Once we have identified the age buckets, we can form dummy variables for those buckets and use them as features.
在这里,客户的年龄介于18至60岁之间。如果不使用年龄作为变量,那么我们可以确定客户具有不同购买方式的年龄段,那么它将在确定客户是否要购买商品方面具有更大的解释力。 一旦确定了年龄段,就可以为这些年龄段形成哑变量并将其用作特征。
In this histogram, we see that the distribution of ages among the customers who have purchased differs from the customers who haven’t. The red rectangles, which represent the number of customers who have purchased, are higher in lower to middle age buckets. But the blue rectangles are higher for the high age buckets, which indicates the chance of not-purchased is more for higher age groups.
在此直方图中,我们看到已购买客户中的年龄分布与未购买客户中的年龄分布不同。 红色矩形代表已购买的客户数量,在中低年龄段的存储桶中较高。 但是,对于较高年龄段的用户来说,蓝色矩形的位置较高,这表明较高年龄段的用户未购买的机会更大。

The understanding from the above histogram led to generate a new variable “age_group” that contains the age buckets instead of actual variable values. It will help us build new dummy variables for each age bucket.
从上述直方图中的理解导致生成了一个新变量“ age_group”,其中包含年龄段,而不是实际变量值。 这将帮助我们为每个年龄段构建新的虚拟变量。

The same applies to the variable “EstimatedSalary” too. The salary of the customers varies from 15000 to 150000. I divided the range into nine buckets. Here you may have to experiment on how many buckets you should form. The target is to bring out an adequate number of buckets that differentiates the salary distribution between the purchased and not-purchased customers.
变量“ EstimatedSalary”也是如此。 客户的薪水从15000到150000不等。我将范围分为9个时段。 在这里,您可能需要试验应该形成多少个存储桶。 目标是带出足够数量的存储桶,以区分已购买和未购买客户之间的工资分配。
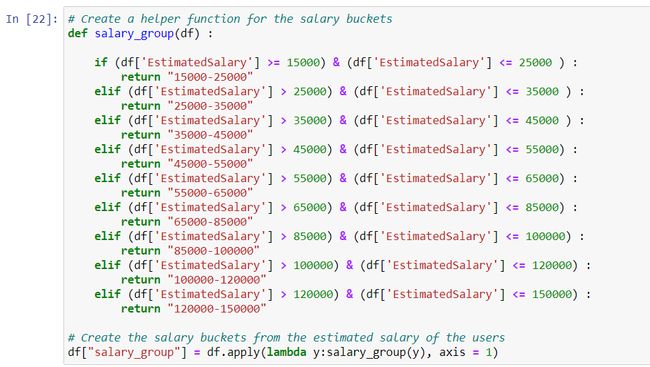
The variable “salary_group” is formed based on the pattern observed in the histogram.
变量“ salary_group”是基于直方图中观察到的模式形成的。

The distribution of gender does not differ significantly over customers’ purchased status. You must have noticed that female customers are slightly more inclined towards purchasing the products.
性别分布在客户购买状态上没有显着差异。 您一定已经注意到,女性顾客更倾向于购买产品。
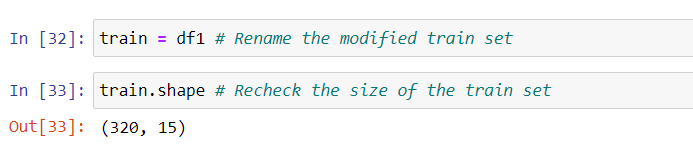
Once we explored all the variables in the data set, it’s time to finalize the features for the classification model. The features you will create for the train set, has to be exactly repeated for the validation set and the test set.
浏览完数据集中的所有变量后,就该确定分类模型的功能了。 您将为训练集创建的功能,对于验证集和测试集必须完全重复。

Thus we have created all the features and dummy variables for the model. I dropped the original variables, keeping only the dummies. While creating dummy variables I dropped one dummy variable from each group to avoid the dummy variable trap.
因此,我们为模型创建了所有特征和虚拟变量。 我删除了原始变量,只保留了虚拟变量。 在创建虚拟变量时,我从每个组中删除了一个虚拟变量,以避免陷入虚拟变量陷阱。
When we create dummy variables for any categorical variable, a dummy is created from each category. The Linear combination of all the dummies from a variable is always 1. As a result, they will be perfectly correlated with the intercept of the model. This is called the dummy variable trap. We avoid this by dropping one dummy for each categorical variable.
当我们为任何类别变量创建虚拟变量时,将从每个类别创建一个虚拟变量。 变量中所有虚拟变量的线性组合始终为1。因此,它们将与模型的截距完美相关。 这称为伪变量陷阱。 我们通过为每个分类变量删除一个虚拟变量来避免这种情况。


It is always a good idea to check the correlation structure of the variables. Multicollinearity makes it difficult to understand the significance of the features in the model.
检查变量的相关结构总是一个好主意。 多重共线性使得很难理解模型中特征的重要性。
Correlation among the created features does not seem to be very strong in our case.
在我们的案例中,创建的特征之间的相关性似乎不是很强。
And the train set is finally ready for model building.
火车终于准备好进行模型构建了。
4.建立模型 (4. Model building)
Before we train the model, we need the validation data to be ready for model validation. The same methods needed to apply to the validation set that we used for the train set.
在训练模型之前,我们需要验证数据为模型验证做好准备。 应用于训练集的验证集所需的方法相同。
At the same time, we can prepare the test data too and keep it for future use.
同时,我们也可以准备测试数据并保留以备将来使用。

We created similar age buckets and salary buckets as we did for the train set. One thing you must check that all the classes of the target variable should be present in the validation set. If not, repeat the train-validation-test split.
我们为火车设置了类似的年龄段和薪水段。 必须做一件事,检查目标变量的所有类都应存在于验证集中。 如果不是,请重复训练验证测试拆分。

We have created the same features for the validation set and the test set.
我们为验证集和测试集创建了相同的功能。
There are several algorithms for dealing with classification problems. It is not very convenient to know beforehand which model will perform better. We always try several models and compare their performances. In real-life scenarios, performance parameters can be prediction accuracy, execution time, and resource consumption.
有几种处理分类问题的算法。 事先知道哪种模型性能更好并不是很方便。 我们总是尝试几种模型并比较它们的性能。 在实际场景中,性能参数可以是预测准确性,执行时间和资源消耗。

Here I have used a Random Forest model as a classifier. Random Forest builds several decision trees by sampling features from the train set. Each of these trees classifies the observations. Random Forest combines these decisions and extracts the most likely one. This is method is called bagging.
在这里,我使用了随机森林模型作为分类器。 随机森林通过从训练集中采样特征来构建几个决策树。 这些树中的每一个都将观测分类。 随机森林将这些决策结合起来,并提取最可能的决策。 这种方法称为装袋。

I have used default parameters to build the model. You can further optimize the classifier using the parameters like — n_estimators, max_depth, min_samples_split, min_samples_leaf, etc.
我已经使用默认参数来构建模型。 您可以使用诸如n_estimators,max_depth,min_samples_split, min_samples_leaf等参数进一步优化分类器。
Save your model as a pickle file for future use. You should save the models with proper version names so that you can distinguish them when you will revisit them.
将模型另存为泡菜文件,以备将来使用。 您应该使用正确的版本名称保存模型,以便在重新访问模型时可以区分它们。

I saved the model in my work directory and then loaded it again as I am using a single notebook.
我将模型保存在工作目录中,然后在使用单个笔记本时再次加载该模型。
5.模型评估 (5. Model evaluation)
We arrived at a point where we have to answer a few questions like — How good the model is? Does it match our expectations? If not, what to do?
我们到了必须回答几个问题的地步,例如-模型的质量如何? 它符合我们的期望吗? 如果没有,该怎么办?
To check the model, I have used the validation data set. The target classes of the validation set have been predicted. To judge how good the model is, we need to use some metrics of judgment.
为了检查模型,我使用了验证数据集。 验证集的目标类别已被预测。 要判断模型的好坏,我们需要使用一些判断指标。
The confusion matrix is a good way to represent the model performance. It shows the counts of positive and negative classes in the actual data and predicted results. Here positive class means the class with the label “Purchased” which is denoted by 1.
混淆矩阵是表示模型性能的好方法。 它显示了实际数据和预测结果中阳性和阴性类别的计数。 此处的肯定类别是指标签为“已购买”的类别,由1表示。


The above function provides a way to represent the confusion matrix with nice visualization. The function can visualize the confusion matrix with normalization (percentage figures) or without normalization (counts).
上面的函数提供了一种以良好的可视化方式表示混淆矩阵的方法。 该函数可以使用标准化(百分比数字)或不使用标准化(计数)来可视化混淆矩阵。
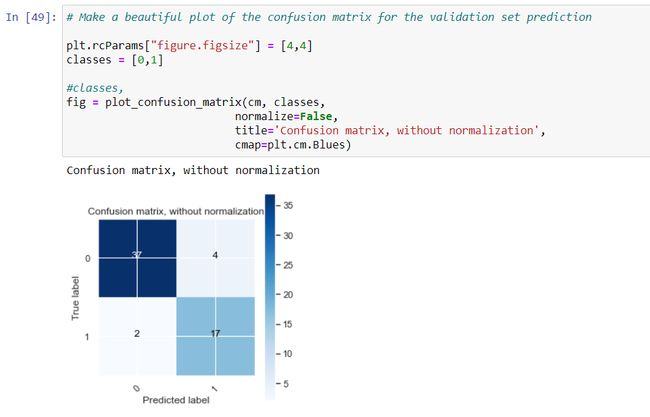
This matrix represents the true label and predicted label with their counts. For 17 observations out of 19, the true and predicted labels are the same for the class 1. That means, out of 19 customers who have purchased the model can predict 17. The same for the class not-purchased is 37 out of 41.
该矩阵代表真实标签和预测标签及其计数。 对于19个类别中的17个观察值,类别1的真实和预测标签相同。这意味着,在购买模型的19个客户中可以预测17个类别。未购买类别的真实对象和预测标签是41个类别中的37个。
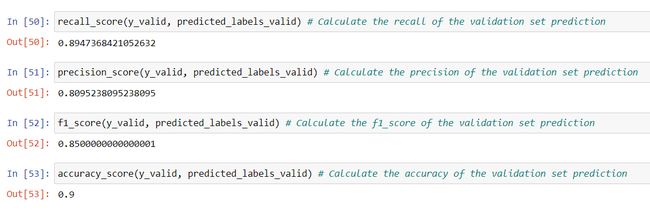
To make it more concise, we have metrics like — precision, recall, F1-Score, accuracy, etc. For the classification models with imbalance class (the distribution of classes is not uniform), precision and recall are the matrics we rely on. The higher the measures are, the better the model is.
为了使其更简洁,我们使用诸如精度,召回率,F1-分数,准确性等度量标准。对于具有不平衡类别(类别分布不统一)的分类模型,精度和召回率是我们所依赖的矩阵。 度量值越高,模型越好。
Precision is calculated by the ratio of two values. The number of customers for whom the model has predicted as “purchased”. And the number of customers who actually have purchased the product.
精度由两个值的比值计算。 该模型已将其预测为“已购买”的客户数量。 以及实际购买该产品的客户数量。
Recall expresses — among the customers who have actually purchased, how many of them have been correctly identified by the model.
召回表述-在实际购买的客户中,模型正确识别了其中的多少。
Now, it is difficult to maximize precision and recall together. F1-Score is a measure that saves us from this situation. It is the harmonic mean of precision and recall. It helps us to keeps a balance between them.
现在,很难最大程度地提高精度并一起召回。 F1-分数是一种使我们摆脱这种情况的措施。 它是精度和查全率的谐和平均值。 它有助于我们在两者之间保持平衡。
The model algorithm does not provide the target classes directly. It provides the probability of belonging to each class. If the probability of positive class is more than 0.5 then it is labeled as 1 otherwise 0.
模型算法不直接提供目标类。 它提供了属于每个类别的概率。 如果阳性类别的概率大于0.5,则将其标记为1,否则标记为0。
This threshold value of probability can be optimized. We can check among all the thresholds which one provides the best classification result. It can be done by the precision-recall curve.
该概率阈值可以被优化。 我们可以检查所有阈值中提供最佳分类结果的阈值。 可以通过精确调用曲线来完成。

So, instead of predicting the classes directly, I have extracted from the model the probabilities for each observation of the validation set. Using the precision-recall curve, the best threshold of probability has been found as 0.332714.
因此,我没有直接预测类,而是从模型中提取了验证集每次观察的概率。 使用精确召回曲线,发现最佳概率阈值为0.332714。
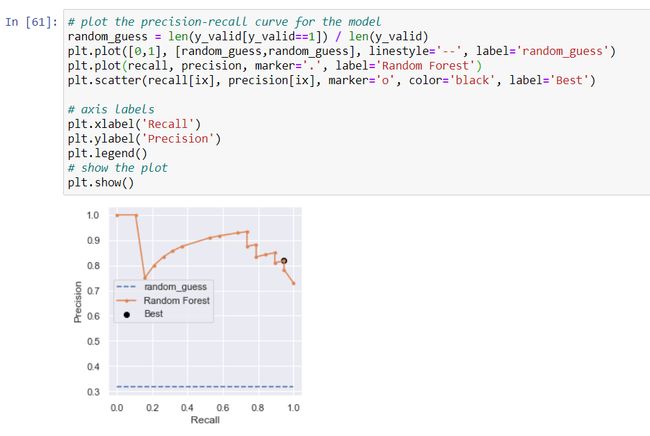
The graph visualizes the best threshold in the precision-recall curve. It optimizes both precisions and recalls for the predictions.
该图将精确调用曲线中的最佳阈值可视化。 它优化了预测的准确性和查全率。
There are several other methods of model evaluation and parameter tuning. I could not get into all those to keep the discussion simple.
模型评估和参数调整还有其他几种方法。 为了使讨论变得简单,我无法深入探讨所有这些内容。
Model training and evaluation are recursive processes. You need to revisit the training and evaluation number of times to take it to a satisfactory level. Every time you need to tune the parameters of the model if the evaluation process does not reveal satisfactory results. I avoided this part in this article.
模型训练和评估是递归过程。 您需要重新访问培训和评估次数才能达到令人满意的水平。 如果评估过程无法显示令人满意的结果,则每次需要调整模型的参数时。 我在本文中避免了这一部分。
Now, it time to check how the model performs on the unseen test data. It will resemble how the model is going to perform if it is deployed into a real-life application.
现在,该检查模型在看不见的测试数据上的表现了。 如果将模型部署到实际应用程序中,它将类似于模型的执行方式。
测试集上的模型评估 (Model evaluation on the test set)
Before using the model for prediction on the test set, you must check the shape of the test set. Ensure that the number of features present in the test set is equal to the number in the train set.
在将模型用于测试集上进行预测之前,必须检查测试集的形状。 确保测试集中存在的特征数量等于训练集中的特征数量。

In our case, three features were missing in the test set. Those are the dummy variables created from the estimated salary. As those salary buckets were absent in the test set, I inserted the dummies with zeros for them.
在我们的案例中,测试集中缺少三个功能。 这些是根据估计薪水创建的虚拟变量。 由于测试集中没有这些薪水桶,因此我为它们插入了零的假人。


I used the threshold probability, estimated in the validation set, to predict for the observation in the test set.
我使用在验证集中估计的阈值概率来预测测试集中的观察结果。

The confusion matrix shows that all the customers with the “Purchased” label have been predicted correctly. So, the recall value is 1.
混淆矩阵显示,所有带有“已购买”标签的客户均已正确预测。 因此,召回值为1。

The F1-Score for the set is 0.85. I would say that the model is providing us a decent performance. And we achieved that with a pretty straightforward and simple approach.
该组的F1-分数是0.85。 我要说的是,该模型为我们提供了不错的表现。 我们通过一种非常简单明了的方法实现了这一目标。
An 85% F1-Score could be an excellent performance in many situations. However, the required accuracy from a model depends on various factors.
在许多情况下,85%的F1-Score可能是出色的表现。 但是,模型所需的精度取决于各种因素。
6.模型部署 (6. Model deployment)
Once you are satisfied with your model performance, you should check it with the business executives. You need to have a detailed discussion about the implication of your results and if it aligns with the business understandings.
对模型绩效感到满意后,应与业务主管联系。 您需要就结果的含义以及是否与业务理解保持一致进行详细讨论。
Also, you need to confirm with business executives about the desired accuracy level. Decisions have to be made on deployment strategy, frequency of model revision, mode of delivery of the output, etc.
另外,您需要与业务主管确认所需的准确性级别。 必须决定部署策略,模型修订的频率,输出的交付方式等。
It may happen that your model output will be consumed by other applications or even it might go to the business people in the form of a CSV file.
您的模型输出可能会被其他应用程序占用,甚至可能以CSV文件的形式发送给业务人员。
The way I represented the code in this article is more of a discrete manner. In real-life situations, we prefer to segment the script in different blocks and to use classes and functions to organize them.
我在本文中表示代码的方式更多是离散的方式。 在现实生活中,我们倾向于将脚本分成不同的块,并使用类和函数来组织它们。
Also, a separate script module is required to be prepared for the inference of the model. This script will fetch the data from a particular data storage, draw inference on the data, and save the output in a specified output location.
而且,需要准备一个单独的脚本模块以进行模型推断。 该脚本将从特定的数据存储中获取数据,对数据进行推断,然后将输出保存在指定的输出位置。
You will need a scheduler for the model to run after a specific interval. If other applications are depending on the output of this model, you need to synchronize them in the right order.
您将需要一个调度程序,以便模型在特定时间间隔后运行。 如果其他应用程序依赖于此模型的输出,则需要以正确的顺序对其进行同步。
It is really hard to bring all the aspects of the machine learning projects in a single article. I tried my best to cover most of them. I might have missed some facts to mention here. But I believe I have been able to bring a summary of the entire journey in front of you.
很难在一篇文章中介绍机器学习项目的所有方面。 我尽力涵盖了大部分内容。 我可能会错过一些要在这里提及的事实。 但是我相信我已经能够将整个旅程的摘要呈现在您面前。
Data science is an emerging field. Many aspirants are joining the data science industry in the pursuit of becoming a data scientist. I hope this article will help them get a fair idea about the steps a data science project involves.
数据科学是一个新兴领域。 许多追求者正在加入数据科学行业,以寻求成为数据科学家。 我希望本文能帮助他们对数据科学项目涉及的步骤有一个清晰的认识。
You can download the notebook from here.
您可以从此处下载笔记本。
https://machinelearningmastery.com/roc-curves-and-precision-recall-curves-for-imbalanced-classification/
https://machinelearningmastery.com/roc-curves-and-precision-recall-curves-for-imbalanced-classification/
2. https://stackoverflow.com/questions/19233771/sklearn-plot-confusion-matrix-with-labels/48018785
2. https://stackoverflow.com/questions/19233771/sklearn-plot-confusion-matrix-with-labels/48018785
Thank you for reading my article. If you liked this article, you might like my other articles. Here are some of them.
感谢您阅读我的文章。 如果您喜欢这篇文章,可能会喜欢我的其他文章。 这里是其中的一些。
翻译自: https://towardsdatascience.com/how-data-scientists-build-machine-learning-models-in-real-life-f1f333022fb7
机器学习 建立模型