基于多级适应方法的无人机(UAV)在发动机输出情况下的导航和路径规划附Matlab代码
✅作者简介:热爱科研的Matlab仿真开发者,修心和技术同步精进,matlab项目合作可私信。
个人主页:Matlab科研工作室
个人信条:格物致知。
更多Matlab仿真内容点击
智能优化算法 神经网络预测 雷达通信 无线传感器
信号处理 图像处理 路径规划 元胞自动机 无人机 电力系统
⛄ 内容介绍
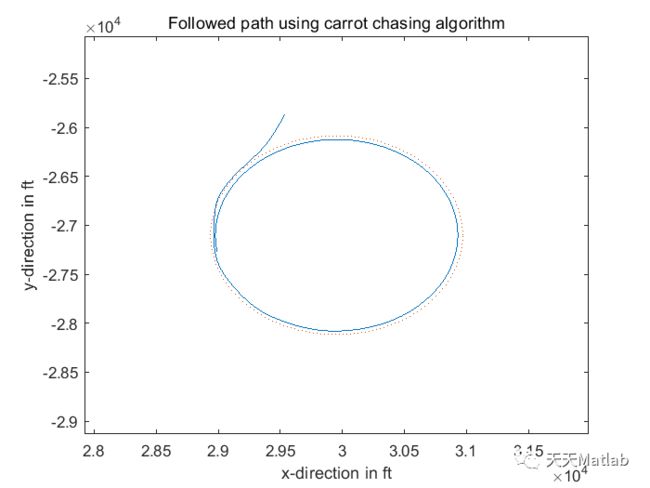
This repository contains MASC Online navigation scheme, with support of Non linear guidance logic, a high fidelity simulation environment(X-Plane), and User Datagram Protocol (UDP) based interface. The system takes in landing zone coordinates and position coordinates where engine is malfunction. It later navigates the engine-out airplane to the approachable safty landing position in real-time. A demonstration of the system can be found here -> https://drive.google.com/file/d/1WmX2kXaYxDslZy5klvJAoZgwgKunmYe_/view?usp=sharing
⛄ 部分代码
%% plot the real time trajectory in sunny weather in three view
figure()
%X_13163_Y_7164.9_Z_3000_ZARA1090
p=plot3(X_13163_1.Data,Y_7164_9_1.Data,Z_3000_1.Data,'-r');
hold on
%X_13353_Y_14380_Z_4000
q=plot3(X_13353_2.Data,Y_14380_2.Data,Z_4000_2.Data,'-g');
hold on
%X_23429_Y_6675.6_Z_5000
r=plot3(X_23429_3.Data,Y_6675_6_3.Data,Z_5000_3.Data,'-b');
hold on
%X_21323_Y_11021_Z_2000_Heading_69.594
a=plot3(X_13353_4.Data,Y_14380_4.Data,Z_4000_4.Data,'-c');
hold on
%X_20719_Y_11652_Z_3000_Heading_256.8
b=plot3(X_13353_5.Data,Y_14380_5.Data,Z_4000_5.Data,'-m');
hold on
xlabel('North (m)')
ylabel('East (m)')
zlabel('Height (m)')
title('Emergency Landing Trajectory')
p.LineWidth = 2;
q.LineWidth = 2;
r.LineWidth = 2;
a.LineWidth = 2;
b.LineWidth = 2;
legend('Trail 1','Trail 2','Trail 3','Trail 4','Trail 5')
grid on
figure()
%X_13163_Y_7164.9_Z_3000_ZARA1090
p=plot(X_13163_1.Data,Y_7164_9_1.Data,'-r');
hold on
%X_13353_Y_14380_Z_4000
q=plot(X_13353_2.Data,Y_14380_2.Data,'-g');
hold on
%X_23429_Y_6675.6_Z_5000
r=plot(X_23429_3.Data,Y_6675_6_3.Data,'-b');
hold on
%X_21323_Y_11021_Z_2000_Heading_69.594
a=plot(X_13353_4.Data,Y_14380_4.Data,'-c');
hold on
%X_20719_Y_11652_Z_3000_Heading_256.8
b=plot(X_13353_5.Data,Y_14380_5.Data,'-m');
hold on
title('Emergency Landing Trajectory(Top View)')
p.LineWidth = 2;
q.LineWidth = 2;
r.LineWidth = 2;
a.LineWidth = 2;
b.LineWidth = 2;
legend('Trail 1','Trail 2','Trail 3','Trail 4','Trail 5')
grid on
figure()
%X_13163_Y_7164.9_Z_3000_ZARA1090
p=plot(X_13163_1.Data,Z_3000_1.Data,'-r');
hold on
%X_13353_Y_14380_Z_4000
q=plot(X_13353_2.Data,Z_4000_2.Data,'-g');
hold on
%X_23429_Y_6675.6_Z_5000
r=plot(X_23429_3.Data,Z_5000_3.Data,'-b');
hold on
%X_21323_Y_11021_Z_2000_Heading_69.594
a=plot(X_13353_4.Data,Z_4000_4.Data,'-c');
hold on
%X_20719_Y_11652_Z_3000_Heading_256.8
b=plot(X_13353_5.Data,Z_4000_5.Data,'-m');
hold on
title('Emergency Landing Trajectory(Side View)')
p.LineWidth = 2;
q.LineWidth = 2;
r.LineWidth = 2;
a.LineWidth = 2;
b.LineWidth = 2;
legend('Trail 1','Trail 2','Trail 3','Trail 4','Trail 5')
grid on
%% plot the real time trajectory in windy weather and Turbulence in three view
figure()
%X21338Y_10911Z5000_82.481_20_14_10_10_10Turbulence
%p=plot3(X_21338_1.Data,Y_10911_1.Data,Z_1.Data,'-r');
%hold on
%X21720Y_12935Z5000_189.86_0_3_8_14
q=plot3(X_21720_2.Data,Y_12935_2.Data,Z_2.Data,'-g');
hold on
%X21837Y_13166Z5000_0_3_8_14
r=plot3(X_21837_3.Data,Y_13166_3.Data,Z_3.Data,'-b');
hold on
%X22164Y_12859Z5000_255.82_14_7_12_22
a=plot3(X_22164_4.Data,Y_12859_4.Data,Z_4.Data,'-c');
hold on
%X22194Y_13161Z5000_230.34_27_12_4_9_4Turbulence
b=plot3(X_22194_5.Data,Y_13161_5.Data,Z_5.Data,'-m');
hold on
xlabel('North (m)')
ylabel('East (m)')
zlabel('Height (m)')
title('Emergency Landing Trajectory')
%p.LineWidth = 2;
q.LineWidth = 2;
r.LineWidth = 2;
a.LineWidth = 2;
b.LineWidth = 2;
legend('Trail 1','Trail 2','Trail 3','Trail 4')
grid on
figure()
%X21338Y_10911Z5000_82.481_20_14_10_10_10Turbulence
%p=plot3(X_21338_1.Data,Y_10911_1.Data,Z_1.Data,'-r');
%hold on
%X21720Y_12935Z5000_189.86_0_3_8_14
q=plot(X_21720_2.Data,Z_2.Data,'-g');
hold on
%X21837Y_13166Z5000_0_3_8_14
r=plot(X_21837_3.Data,Z_3.Data,'-b');
hold on
%X22164Y_12859Z5000_255.82_14_7_12_22
a=plot(X_22164_4.Data,Z_4.Data,'-c');
hold on
%X22194Y_13161Z5000_230.34_27_12_4_9_4Turbulence
b=plot(X_22194_5.Data,Z_5.Data,'-m');
hold on
xlabel('North (m)')
ylabel('East (m)')
zlabel('Height (m)')
title('Emergency Landing Trajectory(Side View)')
%p.LineWidth = 2;
q.LineWidth = 2;
r.LineWidth = 2;
a.LineWidth = 2;
b.LineWidth = 2;
legend('Trail 1','Trail 2','Trail 3','Trail 4')
grid on
figure()
%X21338Y_10911Z5000_82.481_20_14_10_10_10Turbulence
%p=plot3(X_21338_1.Data,Y_10911_1.Data,Z_1.Data,'-r');
%hold on
%X21720Y_12935Z5000_189.86_0_3_8_14
q=plot(X_21720_2.Data,Y_12935_2.Data,'-g');
hold on
%X21837Y_13166Z5000_0_3_8_14
r=plot(X_21837_3.Data,Y_13166_3.Data,'-b');
hold on
%X22164Y_12859Z5000_255.82_14_7_12_22
a=plot(X_22164_4.Data,Y_12859_4.Data,'-c');
hold on
%X22194Y_13161Z5000_230.34_27_12_4_9_4Turbulence
b=plot(X_22194_5.Data,Y_13161_5.Data,'-m');
hold on
xlabel('North (m)')
ylabel('East (m)')
zlabel('Height (m)')
title('Emergency Landing Trajectory(Top View)')
%p.LineWidth = 2;
q.LineWidth = 2;
r.LineWidth = 2;
a.LineWidth = 2;
b.LineWidth = 2;
legend('Trail 1','Trail 2','Trail 3','Trail 4')
grid on
%% plot distance between the configured final coordinate and airplane
Cross_Track_Deviation = distancef.Data(:);
Time = distancef.Time;
figure()
p=plot(Time, Cross_Track_Deviation,'-r');
xlabel('time in (sec/10)')
ylabel('distance between airplane and final position(m)')
title('Variation of distance between airplane and final position with time')
p.LineWidth = 3;
grid on
%% plot distance between the loiter center and airplane
Cross_Track_Deviation = distance.Data(:);
Time = distance.Time;
figure()
p=plot(Time, Cross_Track_Deviation,'-r');
xlabel('time in (sec/10)')
ylabel('distance between airplane and loiter center(m)')
title('Variation of distance between airplane and loiter center with time')
p.LineWidth = 3;
grid on
%% plot the cross tracking error
Cross_Track_Deviation = Cross_Tracking_Error.Data(:);
Time = Cross_Tracking_Error.Time;
figure()
p=plot(Time, Cross_Track_Deviation,'-r');
xlabel('time in (sec/10)')
ylabel('cross track deviation(m)')
title('Variation of cross track deviation with time')
p.LineWidth = 3;
grid on
%% plot the step response of high fidelity and low fiedelity autopilot
highFidelityRollAngle = RollAngle_High.Data(:);
highFidelityTime = RollAngle_High.Time;
figure()
p=plot(highFidelityTime, highFidelityRollAngle,'-r');
title('Roll Angle Step Response')
xlim([0 30])
ylim([0.02 0.2])
p.LineWidth = 2;
lowFidelityRollAngle = RollAngle_Low.Data(:);
lowFidelityTime = RollAngle_Low.Time;
hold on;
q=plot(lowFidelityTime, lowFidelityRollAngle,'--b');
q.LineWidth = 2;
legend('High-Fidelity Response', 'Low-Fidelity Response', 'Location','southeast')
⛄ 运行结果
⛄ 参考文献
[1]罗诚. 无人机路径规划算法研究[D]. 复旦大学, 2010.
⛄ Matlab代码关注
❤️部分理论引用网络文献,若有侵权联系博主删除
❤️ 关注我领取海量matlab电子书和数学建模资料


