实验一:用python实现感知机并对鸢尾花数据集分类
实验一:用python实现感知机并对鸢尾花数据集分类
1. 实验内容:
(1) 用你熟知的语言(尽量使用python)实现感知器的算法,并在给定的数据集上训练。
(2) 在测试集上用训练好的感知器模型进行测试,并将预测结果以csv格式保存为一行预测的分类。
(3) 简要说明算法原理,记录实验过程的关键步骤,以及实验过程中遇到的问题和解决方法。
(4) 尝试与上次实验进行数据互换对比两种算法。
2. 实验说明:
数据集为鸢尾花数据集,有三个类别,其中setosa与另外两种之间是线性可分的,因此你需要选择按照setosa和versicolor,或setsosa和virginica,进行训练分类。
实验过程中不可以直接调用第三方库封装好的训练函数,但可以使用基础类和函数,例如numpy的数组以及矩阵内积dot函数等(算法迭代过程必须自己完成)。
算法具体实现方式无要求,函数或是类封装均可,但是要写进实验报告内。不必粘贴代码,但要有实验过程关键步骤的截图。
可以尝试利用可视化分析实验过程(非必须)。
3. 报告要求:
实验必须独立完成不得抄袭借鉴他人的实验内容。
4. 原理说明:
简要说明感知器算法原理,可以借助伪代码来进行说明。
4.1 文字描述:
感知机是一个二分类的线性模型,它的目的是寻找一个能将训练集正实例点和负实例点完全正确分开的超平面,即将输入数据线性分为两类(用1和-1标识)。
感知机的输入是实例的特征向量,输出是实例的类别,分别是+1和-1。即输入实例各属性值组成的向量,根据这些属性值进行分类,并做好标签输出。
当我们掌握了输入、输出以及最终目的时,可以发现最重要的部分是分类使用的方法——对一个实例的每个属性进行加权,并求和修正,判断正负,实现正实例点和负实例点的区分。
4.2 数学抽象:
4.2.1 输入部分:
- 输入空间(特征空间) X ⊆ R D X \subseteq \mathbb R^D X⊆RD
- x ∈ X x \in X x∈X 表示样本的特征向量,对应输入空间(特征空间)中的点。
4.2.2 输出部分:
- 输出空间(类别空间)是 Y = { + 1 , − 1 } Y = \{+1,-1\} Y={+1,−1} ,输出 Y Y Y 表示样本的类别。
4.2.3 训练内容:
-
给定训练集 D = { ( x ( 1 ) , y ( 1 ) ) , ( x ( 2 ) , y ( 2 ) ) , … … , ( x ( N ) , y ( N ) ) } D = \{(\mathbf x^{(1)},y^{(1)}),(\mathbf x^{(2)},y^{(2)}),……,(\mathbf x^{(N)},y^{(N)})\} D={(x(1),y(1)),(x(2),y(2)),……,(x(N),y(N))} ,其中 x ( n ) ∈ X \mathbf x^{(n)} \in X x(n)∈X , y ( n ) ∈ Y \mathbf y^{(n)} \in Y y(n)∈Y , n = 1 , 2 , 3 , … … , N n = 1,2,3,……,N n=1,2,3,……,N
-
构建线性分类器,即学习一个由属性的线性组合构成的函数。对于一个给定的 D D D维样本 x = [ x 1 , … … , x D ] T \mathbf x = [x_1,……,x_D]^T x=[x1,……,xD]T ,其线性组合为
f ( x ) = w 1 x 1 + w 2 x 2 + … … + w D x D + b f(\mathbf x) = w_1x_1+w_2x_2+……+w_Dx_D+b f(x)=w1x1+w2x2+……+wDxD+b
即
f ( x ) = w T x + b f(\mathbf x) =\mathbf {w^T x}+b f(x)=wTx+b
其中 w \mathbf w w为 D D D维的权重向量, b b b为偏置。 -
构建映射关系,即输入空间到输出空间的映射函数为:
s i g n ( f ( x ) ) = s i g n ( w T x + b ) = { + 1 , f(x) ≥ 0 − 1 , f(x) < 0 sign(f(\mathbf x)) = sign(\mathbf {w^T x}+b) = \begin{cases} +1, & \text{f(x) $\ge$ 0} \\ -1, & \text{f(x) $\lt$ 0} \end{cases} sign(f(x))=sign(wTx+b)={+1,−1,f(x) ≥ 0f(x) < 0
4.2.4 训练策略:
-
根据训练内容可知,我们需要训练的参数为 w \mathbf w w和 b b b
-
当分类正确时,总满足:
y ( n ) ( w T x ( n ) + b ) > 0 y^{(n)}(\mathbf{w^T x^{(n)}}+b)>0 y(n)(wTx(n)+b)>0
当分类错误时,总满足:
y ( n ) ( w T x ( n ) + b ) < 0 y^{(n)}(\mathbf{w^T x^{(n)}}+b)<0 y(n)(wTx(n)+b)<0
所以可以根据上述公式来判别正确与否并驱动参数的迭代。 -
同时,可以使用损失函数
L ( w , b ) = − ∑ x ( n ) ∈ Q y ( n ) ( w T x ( n ) + b ) L(\mathbf w,b) = -\sum_{x^{(n)}\in Q}y^{(n)}(\mathbf {w^T x^{(n)}}+b) L(w,b)=−x(n)∈Q∑y(n)(wTx(n)+b)
来判断参数的好坏。对于损失函数来说,错误分类样本越少,损失函数就越小。所以在损失函数趋于极小值的过程中,我们可以是用梯度下降法来训练参数。梯度计算如下:
KaTeX parse error: Undefined control sequence: \part at position 9: \frac {\̲p̲a̲r̲t̲ ̲L(\mathbf w,b)}…
利用梯度对参数 w \mathbf w w和 b b b进行更新:
w ← w + η y ( n ) x ( n ) b ← b + η y ( n ) \mathbf w \leftarrow \mathbf w + \eta y^{(n)}\mathbf x^{(n)} \\ b \leftarrow b + \eta y^{(n)} w←w+ηy(n)x(n)b←b+ηy(n)
其中, η ( 0 < η ≤ 1 ) \eta(0 \lt \eta \le 1) η(0<η≤1)是步长,也称为学习率。如此以来,通过多次迭代后,损失函数 L ( w , b ) L(\mathbf w,b) L(w,b)不断减小,直到满足收敛条件(例如, L ( w , b ) = 0 L(\mathbf w,b)=0 L(w,b)=0),完成分类。
4.3 几何意义:
我们可以将权重向量和偏置看作时一个超平面 S S S的参数,感知机可以理解为最小化错误分类样本离超平面的距离。错误分类样本 x ( n ) \mathbf x^{(n)} x(n)到超平面的距离为:
− 1 ∥ w ∥ y ( n ) ( w T x ( n ) + b ) -\frac {1}{\parallel \mathbf w \parallel}y^{(n)}(\mathbf {w^T x^{(n)}}+b) −∥w∥1y(n)(wTx(n)+b)
进而计算错误分类集合Q中的所有样本到超平面的总距离为:
∑ x ( n ) ∈ Q − 1 ∥ w ∥ y ( n ) ( w T x ( n ) + b ) \sum_{\mathbf x^{(n)} \in Q}-\frac {1}{\parallel \mathbf w \parallel}y^{(n)}(\mathbf {w^T x^{(n)}}+b) x(n)∈Q∑−∥w∥1y(n)(wTx(n)+b)
仔细观察,当我们忽略 1 ∥ w ∥ \frac {1}{\parallel \mathbf w \parallel} ∥w∥1后,就可以得到感知机的损失函数,也就补充说明了损失函数定义的由来。
4.4 伪代码:
**输入:**训练集 D = { ( x ( 1 ) , y ( 1 ) ) , ( x ( 2 ) , y ( 2 ) ) , … … , ( x ( N ) , y ( N ) ) } D = \{(\mathbf x^{(1)},y^{(1)}),(\mathbf x^{(2)},y^{(2)}),……,(\mathbf x^{(N)},y^{(N)})\} D={(x(1),y(1)),(x(2),y(2)),……,(x(N),y(N))} ,其中 x ( n ) ∈ X \mathbf x^{(n)} \in X x(n)∈X , y ( n ) ∈ Y \mathbf y^{(n)} \in Y y(n)∈Y , n = 1 , 2 , 3 , … … , N n = 1,2,3,……,N n=1,2,3,……,N ;步长 η ( 0 < η ≤ 1 ) \eta(0 \lt \eta \le 1) η(0<η≤1) .
初始化: w 0 = 0 , b 0 = 0 \mathbf w_0 = 0,b_0 = 0 w0=0,b0=0 ;
r e p e a t \mathbf repeat repeat
选取训练集中的一个样本 ( x ( n ) , y ( n ) ) (x^{(n)},y^{(n)}) (x(n),y(n));
i f y ( n ) ( w T x ( n ) + b ) ≤ 0 t h e n \mathbf if \ \ \ y^{(n)}(\mathbf {w^T x^{(n)}}+b) \le 0 \ \ \mathbf then if y(n)(wTx(n)+b)≤0 then
w ← w + η y ( n ) x ( n ) \mathbf w \leftarrow \mathbf w + \eta y^{(n)}\mathbf x^{(n)} w←w+ηy(n)x(n)
b ← b + η y ( n ) b \leftarrow b + \eta y^{(n)} b←b+ηy(n)
e n d i f \mathbf {end \ \ if} end if
u n t i l \mathbf until until 满足收敛条件;
输出: w , b \mathbf w,b w,b
在感知机算法中,采用错误驱动的迭代方法, 用类似于贪心的策略调整参数,直到可以被正确分类。但当给定的数据集无法二分类时,会无法收敛,不能得出正确结果。
5. 实验过程:
简要说明实验步骤,重点说明关键步骤,对结果进行分析。
5.1 算法过程化
5.1.1 读取数据
根据所给的csv文件可知,每个样本有4个属性,1个标签,根据数据结构构建数据集和标签集
# 从外部文件提取数据(数据格式:a、b、c、d、label)
# 构建数据集data_set和标签集data_label
data_set = []
data_label = []
with open('./iris/iris_train.csv') as f:
    for line in f.readlines():
        # print( line.strip() )
        line = line.strip().split(',')
        for i in range(len(line)-1):
            line[i] = float(line[i])
        # print(line)
        data_set.append(line[0:4])

        # 为方便计算,将'setosa'记为1,'versicolor'和'virginica'记为-1
        if line[-1] == 'setosa':
            data_label.append(1)
        else:
            data_label.append(-1)

# print(data_label, '\n')
# print(data_set, '\n')
data = np.array(data_set)
label = np.array(data_label)
# print(data)
# print(label)
由于数据集为鸢尾花数据集,有三个类别,其中setosa与另外两种之间是线性可分的,为方便计算,将标签中的’setosa’记为1,'versicolor’和’virginica’记为-1,其余属性均以数组的形式存储。
5.1.2 训练参数
# 初始化权重、偏置、步长
w = np.array([0, 0, 0, 0])
b = 0
alpha = 1

# 计算 (data*w+b)*label,寻找分类错误的点
score = (np.dot(data, w.T) + b) * label
idx = np.where(score <= 0)
loss = np.sum(score[idx])
print('The Loss:%d' % loss)
# print(score)
# print(idx)

# 使用随机梯度下降法求解权重、偏置
iteration = 1
while score[idx].size != 0:
    point = np.random.randint((score[idx].shape[0]))
    x = data[idx[0][point], :]
    y = label[idx[0][point]]
    w = w + alpha * y * x
    b = b + alpha * y
    # print(x)
    # print(y)
    # print(w)
    # print(b)
    score = (np.dot(data, w.T) + b) * label
    idx = np.where(score <= 0)
    loss = np.sum(score[idx])
    print('Iteration:%d  w:%s  b:%s  loss:%d' % (iteration, w, b, loss))
    iteration = iteration + 1
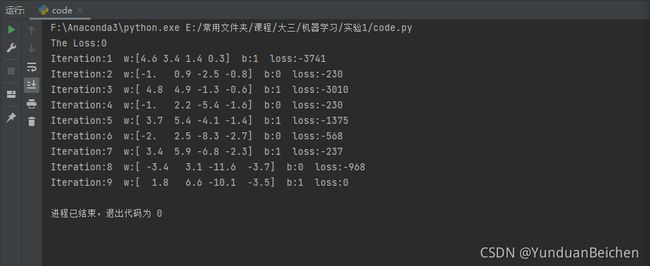
固定步长,使用随机梯度下降法,对权重、偏置进行训练,并配以损失函数初步观察训练效果。
5.1.3 初步效果
根据训练过程可以看出,训练集中的是可以线性分类的,并随着迭代过程,逐步趋于最优解(loss=0)。
5.1.4 可视化
# 绘图显示
index_p = np.where(label == 1)
index_n = np.where(label != 1)
data_p = data[index_p]
data_n = data[index_n]

fig = plt.figure()
ax = fig.add_subplot(111, projection='3d')
x_p = np.transpose(data_p[:, 0])
y_p = np.transpose(data_p[:, 1])
z_p = np.transpose(data_p[:, 2])
s_p = np.transpose(data_p[:, 3])
x_n = np.transpose(data_n[:, 0])
y_n = np.transpose(data_n[:, 1])
z_n = np.transpose(data_n[:, 2])
s_n = np.transpose(data_n[:, 3])
ax.scatter(x_p, y_p, z_p, s=s_p, c='r', marker='^', label='setosa')
ax.scatter(x_n, y_n, z_n, s=s_n, c='b', marker='o', label='versicolor and virginica')
ax.set_xlabel('X Label')
ax.set_ylabel('Y Label')
ax.set_zlabel('Z Label')
ax.legend(loc='best')

print('\nPerceptron learning algorithm is over')
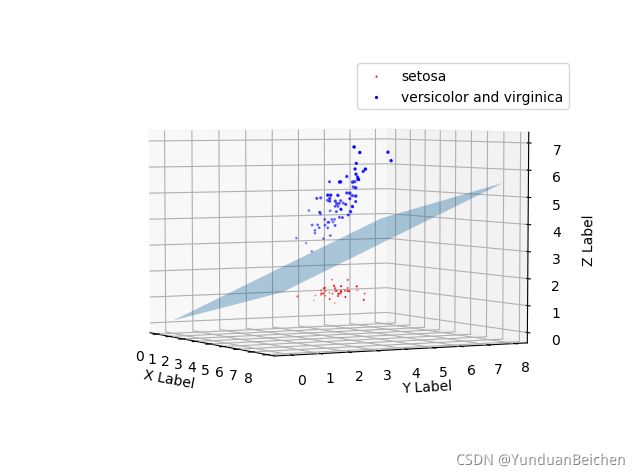
由于样本具有四维属性,而我们生活的空间为三维坐标系,所以我将前三种属性值构成坐标,第四种属性修改为点的大小,以此体现四维属性,并将分类后的样本使用不同颜色划分(红色为’setosa’,蓝色为’versicolor’和’virginica’)。
由图所示,分类效果还是十分良好的。
5.2 算法模块化
5.2.1 数据格式化函数
- 读入训练集
def build_training_set(file):
    data_set = []
    data_label = []
    with open(file) as f:
        for line in f.readlines():
            line = line.strip().split(',')
            for i in range(len(line) - 1):
                line[i] = float(line[i])
            data_set.append(line[0:4])

            # 为方便计算,将'setosa'记为1,'versicolor'和'virginica'记为-1
            if line[-1] == 'setosa':
                data_label.append(1)
            else:
                data_label.append(-1)

    data = np.array(data_set)
    label = np.array(data_label)

    return data, label
- 读入测试集
def build_test_set(testFile, targetsFile):
    data_set = []
    data_label = []
    with open(testFile) as testfile:
        for line in testfile.readlines():
            line = line.strip().split(',')
            for i in range(len(line)):
                line[i] = float(line[i])
            data_set.append(line[0:4])

    with open(targetsFile) as targetsfile:
        for line in targetsfile.readlines():
            line = line.strip().split(',')
            if line[-1] == 'setosa':
                data_label.append(1)
            else:
                data_label.append(-1)

    data = np.array(data_set)
    label = np.array(data_label)

    return data, label
5.2.2 随机梯度法训练参数
def training_parameters(data, label):
    w = np.array([0, 0, 0, 0])
    b = 0
    alpha = 1
    # 计算 (data*w+b)*label,寻找分类错误的点
    score = (np.dot(data, w.T) + b) * label
    idx = np.where(score <= 0)

    # 使用随机梯度下降法求解权重、偏置
    # iteration = 1
    while score[idx].size != 0:
        point = np.random.randint((score[idx].shape[0]))
        x = data[idx[0][point], :]
        y = label[idx[0][point]]
        w = w + alpha * y * x
        b = b + alpha * y

        score = (np.dot(data, w.T) + b) * label
        idx = np.where(score <= 0)
        # loss = np.sum(score[idx])
        # print('Iteration:%d  w:%s  b:%s  loss:%d' % (iteration, w, b, loss))
        # iteration = iteration + 1

    return w, b
5.2.3 可视化
def paint3d(data, label):
    index_p = np.where(label == 1)
    index_n = np.where(label != 1)
    data_p = data[index_p]
    data_n = data[index_n]

    ax = plt.figure().add_subplot(111, projection='3d')
    x_p = np.transpose(data_p[:, 0])
    y_p = np.transpose(data_p[:, 1])
    z_p = np.transpose(data_p[:, 2])
    s_p = np.transpose(data_p[:, 3])
    x_n = np.transpose(data_n[:, 0])
    y_n = np.transpose(data_n[:, 1])
    z_n = np.transpose(data_n[:, 2])
    s_n = np.transpose(data_n[:, 3])
    ax.scatter(x_p, y_p, z_p, s=s_p, c='r', marker='^', label='setosa')
    ax.scatter(x_n, y_n, z_n, s=s_n, c='b', marker='o', label='versicolor and virginica')
    ax.set_xlabel('X Label')
    ax.set_ylabel('Y Label')
    ax.set_zlabel('Z Label')
    ax.legend(loc='best')

    plt.show()
    print('\nPerceptron learning algorithm is over!\n')
5.2.4 查看预测结果
trainingFile = './iris/iris_train.csv'
testFile = './iris/iris_test.csv'
targetsFile = './iris/iris_test_targets.csv'

trainingData, trainingLabel = build_training_set(trainingFile)
testData, targetsLabel = build_test_set(testFile, targetsFile)
trainingW, trainingB = training_parameters(trainingData, trainingLabel)
paint3d(trainingData, trainingLabel)
# print(trainingData, trainingLabel)
# print(testData, targetsLabel)

testScore = (np.dot(testData, trainingW.T) + trainingB)
testLabel = np.array(np.zeros(testScore.shape[0])) - 1
index = np.where(testScore > 0)
testLabel[index] = 1
# print(testLabel)

wrongScore = testLabel * targetsLabel
wrongNum = -np.sum(np.where(wrongScore <= 0))
print('Number of test errors: %d' % wrongNum)
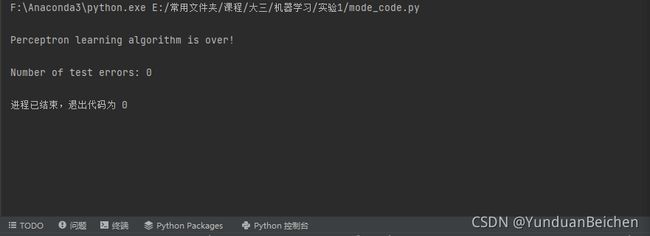
预测结果与目标结果的对比:
- 根据训练得到的参数,计算预测的标签(将’setosa’记为1,'versicolor’和’virginica’记为-1)
- 将预测的标签数组与目标的标签数组相乘,如果预测结果准确,总有 t e s t L a b e l ∗ t a r g e t s L a b e l > 0 testLabel * targetsLabel > 0 testLabel∗targetsLabel>0
- 计算乘积小于0的个数,即为预测出错的个数
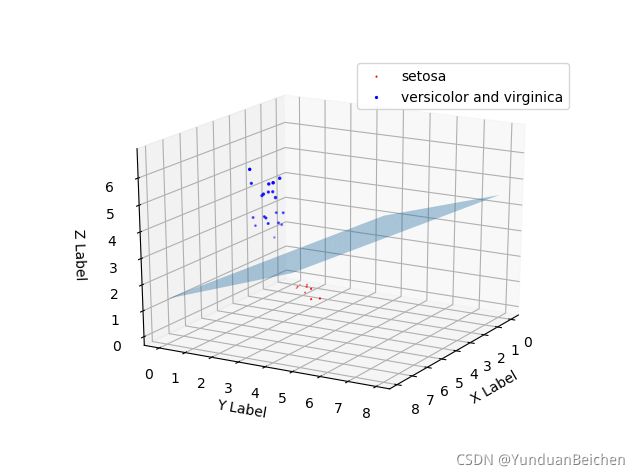
通过可视化展示,可以发现训练结果和分类效果还是相当不错的,根据四维属性,setosa与另外两种之间是线性可分的。
5.2.5 完整代码
import numpy as np
from mpl_toolkits.mplot3d import Axes3D
import matplotlib.pyplot as plt


def build_training_set(file):
    data_set = []
    data_label = []
    with open(file) as f:
        for line in f.readlines():
            line = line.strip().split(',')
            for i in range(len(line) - 1):
                line[i] = float(line[i])
            data_set.append(line[0:4])

            # 为方便计算,将'setosa'记为1,'versicolor'和'virginica'记为-1
            if line[-1] == 'setosa':
                data_label.append(1)
            else:
                data_label.append(-1)

    data = np.array(data_set)
    label = np.array(data_label)

    return data, label


def build_test_set(testFile, targetsFile):
    data_set = []
    data_label = []
    with open(testFile) as testfile:
        for line in testfile.readlines():
            line = line.strip().split(',')
            for i in range(len(line)):
                line[i] = float(line[i])
            data_set.append(line[0:4])

    with open(targetsFile) as targetsfile:
        for line in targetsfile.readlines():
            line = line.strip().split(',')
            if line[-1] == 'setosa':
                data_label.append(1)
            else:
                data_label.append(-1)

    data = np.array(data_set)
    label = np.array(data_label)

    return data, label


def training_parameters(data, label):
    w = np.array([0, 0, 0, 0])
    b = 0
    alpha = 1
    # 计算 (data*w+b)*label,寻找分类错误的点
    score = (np.dot(data, w.T) + b) * label
    idx = np.where(score <= 0)

    # 使用随机梯度下降法求解权重、偏置
    # iteration = 1
    while score[idx].size != 0:
        point = np.random.randint((score[idx].shape[0]))
        x = data[idx[0][point], :]
        y = label[idx[0][point]]
        w = w + alpha * y * x
        b = b + alpha * y

        score = (np.dot(data, w.T) + b) * label
        idx = np.where(score <= 0)
        # loss = np.sum(score[idx])
        # print('Iteration:%d  w:%s  b:%s  loss:%d' % (iteration, w, b, loss))
        # iteration = iteration + 1

    return w, b


def paint3d(data, label):
    index_p = np.where(label == 1)
    index_n = np.where(label != 1)
    data_p = data[index_p]
    data_n = data[index_n]

    ax = plt.figure().add_subplot(111, projection='3d')
    x_p = np.transpose(data_p[:, 0])
    y_p = np.transpose(data_p[:, 1])
    z_p = np.transpose(data_p[:, 2])
    s_p = np.transpose(data_p[:, 3])
    x_n = np.transpose(data_n[:, 0])
    y_n = np.transpose(data_n[:, 1])
    z_n = np.transpose(data_n[:, 2])
    s_n = np.transpose(data_n[:, 3])
    ax.scatter(x_p, y_p, z_p, s=s_p, c='r', marker='^', label='setosa')
    ax.scatter(x_n, y_n, z_n, s=s_n, c='b', marker='o', label='versicolor and virginica')
    ax.set_xlabel('X Label')
    ax.set_ylabel('Y Label')
    ax.set_zlabel('Z Label')
    ax.legend(loc='best')

    plt.show()
    print('\nPerceptron learning algorithm is over!\n')


trainingFile = './iris/iris_train.csv'
testFile = './iris/iris_test.csv'
targetsFile = './iris/iris_test_targets.csv'

trainingData, trainingLabel = build_training_set(trainingFile)
testData, targetsLabel = build_test_set(testFile, targetsFile)
trainingW, trainingB = training_parameters(trainingData, trainingLabel)
paint3d(trainingData, trainingLabel)
# print(trainingData, trainingLabel)
# print(testData, targetsLabel)

testScore = (np.dot(testData, trainingW.T) + trainingB)
testLabel = np.array(np.zeros(testScore.shape[0])) - 1
index = np.where(testScore > 0)
testLabel[index] = 1
# print(testLabel)
# print(targetsLabel)

wrongScore = testLabel * targetsLabel
wrongNum = -np.sum(np.where(wrongScore <= 0))
print('Number of test errors: %d' % wrongNum)
6. 实验问题:
描述实验过程中遇到的问题,以及对应解决办法。
数据格式问题:
在导入csv文件中,为了后期处理更加方便,提前对训练集、测试集、标签集的数据格式做了规定,在编写代码的过程中,有许多小细节需要注意,比如读取文件内容时的分割,读取到的数据进行类型转换,字符串名称与数字对应,从而计算更加简便。
可视化问题:
由于想象力有限,无法直观的画出四维属性图,更不提对应的超平面。解决办法:在三维坐标轴中,增加点的大小、点的颜色等属性,从而体现更多的维度。降低超平面具有的维数(这里有点粗暴,只选取了前三种属性,忽视了第四种属性)。


