机器学习_鸢尾花数据集_python
数据集
iris.data里面储存的鸢尾花特征和类别

数据每一列的含义如下图所示

SVM
#!/usr/bin/python
# -*- coding:utf-8 -*-

import numpy as np
import pandas as pd
import matplotlib as mpl
import matplotlib.pyplot as plt
from sklearn import svm
from sklearn.model_selection import train_test_split
from sklearn.metrics import accuracy_score


# 'sepal length', 'sepal width', 'petal length', 'petal width'
iris_feature = u'花萼长度', u'花萼宽度', u'花瓣长度', u'花瓣宽度'


if __name__ == "__main__":
    path = '..\\8.Regression\\iris.data'  # 数据文件路径
    data = pd.read_csv(path, header=None)
    x, y = data[range(4)], data[4]
    y = pd.Categorical(y).codes
    x = x[[0, 1]]
    x_train, x_test, y_train, y_test = train_test_split(x, y, random_state=1, train_size=0.6)

    # 分类器,decision_function_shape='ovr'用若干二分类得到多分类
    clf = svm.SVC(C=0.1, kernel='linear', decision_function_shape='ovr')
    # clf = svm.SVC(C=0.8, kernel='rbf', gamma=20, decision_function_shape='ovr')
    clf.fit(x_train, y_train.ravel())

    # 准确率
    print(clf.score(x_train, y_train))  # 精度
    print('训练集准确率:', accuracy_score(y_train, clf.predict(x_train)))
    print(clf.score(x_test, y_test))
    print('测试集准确率:', accuracy_score(y_test, clf.predict(x_test)))

    # decision_function
    print('decision_function:\n', clf.decision_function(x_train))
    print('\npredict:\n', clf.predict(x_train))

    # 画图
    x1_min, x2_min = x.min()
    x1_max, x2_max = x.max()
    x1, x2 = np.mgrid[x1_min:x1_max:500j, x2_min:x2_max:500j]  # 生成网格采样点
    grid_test = np.stack((x1.flat, x2.flat), axis=1)  # 测试点
    # print('grid_test = \n', grid_test)
    # Z = clf.decision_function(grid_test)    # 样本到决策面的距离
    # print(Z)
    grid_hat = clf.predict(grid_test)       # 预测分类值
    grid_hat = grid_hat.reshape(x1.shape)  # 使之与输入的形状相同
    mpl.rcParams['font.sans-serif'] = [u'SimHei']
    mpl.rcParams['axes.unicode_minus'] = False

    cm_light = mpl.colors.ListedColormap(['#A0FFA0', '#FFA0A0', '#A0A0FF'])
    cm_dark = mpl.colors.ListedColormap(['g', 'r', 'b'])
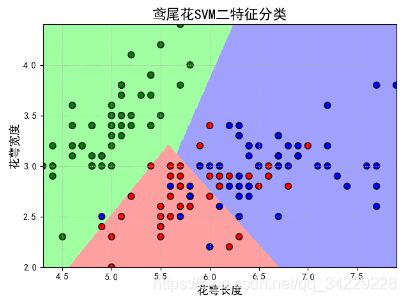
    plt.figure(facecolor='w')
    plt.pcolormesh(x1, x2, grid_hat, cmap=cm_light)
    plt.scatter(x[0], x[1], c=y, edgecolors='k', s=50, cmap=cm_dark)      # 样本
    plt.scatter(x_test[0], x_test[1], s=120, facecolors='none', zorder=10)     # 圈中测试集样本
    plt.xlabel(iris_feature[0], fontsize=13)
    plt.ylabel(iris_feature[1], fontsize=13)
    plt.xlim(x1_min, x1_max)
    plt.ylim(x2_min, x2_max)
    plt.title(u'鸢尾花SVM二特征分类', fontsize=16)
    plt.grid(b=True, ls=':')
    plt.tight_layout(pad=1.5)
    plt.show()
常用机器学习算法包语句总结
- 模型选择包的训练集测试集比例选择
from sklearn.model_selection import train_test_split

# 0.6的测试集,0.4的验证集
x_train, x_test, y_train, y_test = train_test_split(x, y, random_state=1, train_size=0.6)
- SVM
调参参考:机器学习_SVM
# 构建一个线性分类器,多类分,decision_function_shape='ovr'用若干二分类得到多分类
# ovr表示(1,23);(2,13);(3,12)共3个二分类器,看哪个距离大选哪一个
clf = svm.SVC(C=0.1, kernel='linear', decision_function_shape='ovr')
# clf = svm.SVC(C=0.8, kernel='rbf', gamma=20, decision_function_shape='ovr')

# 数据喂给分类器
clf.fit(x_train, y_train.ravel())
- 指标
print('训练集精度:', clf.score(x_train, y_train))  # 精度
print('训练集准确率:', accuracy_score(y_train, clf.predict(x_train)))
print('测试集精度:', clf.score(x_test, y_test))
print('测试集准确率:', accuracy_score(y_test, clf.predict(x_test)))
