Python吴恩达机器学习作业 2 - logistic回归
编程作业2 logistic_regression(逻辑回归)
推荐运行环境:python 3.6
建立一个逻辑回归模型来预测一个学生是否被大学录取,根据两次考试的结果来决定每个申请人的录取机会。有以前的申请人的历史数据,可以用它作为逻辑回归的训练集。
python实现逻辑回归 目标:建立分类器(求解出三个参数 θ 0 θ 1 θ 2 \theta_0 \theta_1 \theta_2 θ0θ1θ2)即得出分界线 备注: θ 1 \theta_1 θ1对应’Exam 1’成绩, θ 2 \theta_2 θ2对应’Exam 2’设定阈值,根据阈值判断录取结果
备注:阈值指的是最终得到的概率值。将概率值转化成一个类别。一般是>0.5是被录取了,<0.5未被录取.实现内容:
sigmold:映射到概率的函数
model:返回预测结果值
cost:根据参数计算损失
gradient:计算每个参数的梯度方向
descent:进行参数更新
accuracy:计算精度
classification_report
import pandas as pd
import numpy as np
import matplotlib.pyplot as plt
import seaborn as sns
plt.style.use('fivethirtyeight') # 样式美化
from sklearn.metrics import classification_report # 这个包是评价报告
准备数据
data = pd.read_csv('ex2data1.txt', names = ['exam1', 'exam2', 'admitted'])
data.head() # 看前五行
| exam1 | exam2 | admitted | |
|---|---|---|---|
| 0 | 34.623660 | 78.024693 | 0 |
| 1 | 30.286711 | 43.894998 | 0 |
| 2 | 35.847409 | 72.902198 | 0 |
| 3 | 60.182599 | 86.308552 | 1 |
| 4 | 79.032736 | 75.344376 | 1 |
data.describe()
| exam1 | exam2 | admitted | |
|---|---|---|---|
| count | 100.000000 | 100.000000 | 100.000000 |
| mean | 65.644274 | 66.221998 | 0.600000 |
| std | 19.458222 | 18.582783 | 0.492366 |
| min | 30.058822 | 30.603263 | 0.000000 |
| 25% | 50.919511 | 48.179205 | 0.000000 |
| 50% | 67.032988 | 67.682381 | 1.000000 |
| 75% | 80.212529 | 79.360605 | 1.000000 |
| max | 99.827858 | 98.869436 | 1.000000 |
##Error TypeError:unhashable type:_ColorPatlette
运行问题更换方案sns.set(context=“notebook”, style=“darkgrid”, palette=sns.color_palette(“RdBu”,2), color_codes=False) 因为自定义了画板颜色
sns.set(context="notebook", style="darkgrid", palette=sns.color_palette("RdBu",2)) # 设置样式参数
sns.lmplot('exam1', 'exam2', hue='admitted', data=data,
          height=6,
          fit_reg=False,  # fig_reg 参数,控制是否显示拟合的直线
          scatter_kws={"s":50}
          )   # hue参数是将name锁指定的不同类型的数据叠加在一张图中显示
plt.show()
def get_X(df): # 读取特征
    ones = pd.DataFrame({'ones' : np.ones(len(df))}) # ones是m行1列的dataframe
    data = pd.concat([ones, df], axis=1) # 合并数据,根据列合并 axis: 需要合并链接的轴,0是行,1是列
    return data.iloc[:, :-1].values # 这个操作返回ndarray,不是矩阵

def get_y(df): # 读取标签
    return np.array(df.iloc[:,-1]) # df.iloc[:, -1]是指df的最后一列

def normalize_feature(df):
    return df.apply(lambda column:(column - column.mean()) / column.std()) # 特征缩放在逻辑回归同样适用
X = get_X(data)
print(X.shape)

y = get_y(data)
print(y.shape)
(100, 3)
(100,)
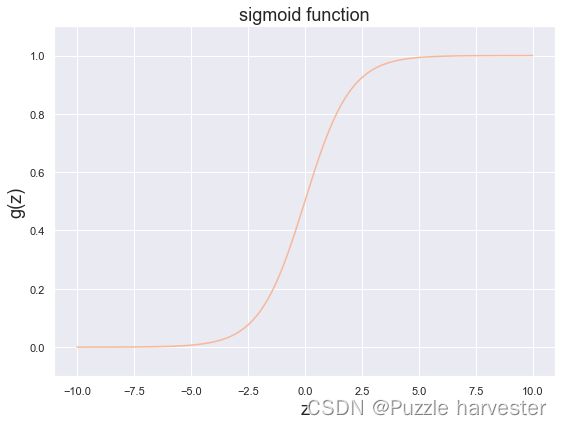
sigmoid 函数
g 代表一个常用的逻辑函数(logistic function) 为S形函数 (Sigmoid function),公式为:
g ( z ) = 1 1 + e − z g(z)=\frac {1}{1+e^{-z}} g(z)=1+e−z1
合起来,我们得到逻辑回归模型的假设函数:
h θ ( x ) = 1 1 + e − θ T X h_\theta(x)=\frac {1}{1+e^{-\theta^TX}} hθ(x)=1+e−θTX1
def sigmoid(z):
    return 1 / (1 + np.exp(-z))
下面程序会调用上面你写好的函数,并画出sigmoid函数图像。如果你的程序正确,你应该能在下方看到函数图像
fig, ax = plt.subplots(figsize = (8,6))
ax.plot(np.arange(-10, 10, step = 0.01),
       sigmoid(np.arange(-10, 10, step = 0.01)))
ax.set_ylim((-0.1, 1.1)) # lim 轴线显示长度
ax.set_xlabel('z', fontsize = 18)
ax.set_ylabel('g(z)', fontsize = 18)
ax.set_title('sigmoid function', fontsize = 18)
plt.show()
cost function(代价函数)
- max ( l ( θ ) ) = min ( − l ( θ ) ) \max(l(\theta))=\min(-l(\theta)) max(l(θ))=min(−l(θ))
- 选择 − l ( θ ) -l(\theta) −l(θ) 作为代价函数
J ( θ ) = − 1 m ∑ i = 1 m [ y ( i ) log ( h θ ( x ( i ) ) ) + ( 1 − y ( i ) ) log ( 1 − h θ ( x ( i ) ) ) ] J(\theta)=-\frac {1}{m}\sum_{i=1}^m[y^{(i)}\log(h_\theta(x^{(i)}))+(1-y^{(i)})\log(1-h_\theta(x^{(i)}))] J(θ)=−m1i=1∑m[y(i)log(hθ(x(i)))+(1−y(i))log(1−hθ(x(i)))]
= 1 m ∑ i = 1 m [ − y ( i ) log ( h θ ( x ( i ) ) ) − ( 1 − y ( i ) ) log ( 1 − h θ ( x ( i ) ) ) ] =\frac {1}{m}\sum_{i=1}^m[-y^{(i)}\log(h_\theta(x^{(i)}))-(1-y^{(i)})\log(1-h_\theta(x^{(i)}))] =m1i=1∑m[−y(i)log(hθ(x(i)))−(1−y(i))log(1−hθ(x(i)))]
theta = np.zeros(3) # X(m*n) so theta is n*1
theta
array([0., 0., 0.])
def cost(theta, X, y):
    return np.mean(-y * np.log(sigmoid(X @ theta)) - (1 - y) * np.log(1 - sigmoid(X @ theta)))
# Hint:X @ theta 与X.dot(theta)等价
cost(theta, X, y)
0.6931471805599453
gradient descent(梯度下降)
- 这是批量梯度下降 (bath gradient descent)
- 转化为向量化计算: 1 m X T ( S i g m o i d ( X θ ) − y ) \frac {1}{m}X^T(Sigmoid(X\theta)-y) m1XT(Sigmoid(Xθ)−y)
∂ J ( θ ) ∂ θ j = 1 m ∑ i = 1 m ( h θ ( x ( i ) ) − y ( i ) ) x j ( i ) \frac {\partial J(\theta)}{\partial\theta_j}=\frac {1}{m}\sum_{i=1}^{m}(h_\theta(x^{(i)})-y{(i)})x_{j}^{(i)} ∂θj∂J(θ)=m1i=1∑m(hθ(x(i))−y(i))xj(i)
def gradient(theta, X, y):
    return (1 / len(X)) * X.T @ (sigmoid(X @ theta) - y)
gradient(theta, X, y)
array([ -0.1 , -12.00921659, -11.26284221])
拟合参数
这里我们使用scipy.optimize.mininize 去寻找参数
import scipy.optimize as opt
res = opt.minimize(fun = cost, x0 = theta, args = (X, y), method = 'Newton-CG', jac=gradient)
print(res)
     fun: 0.20349770249211604
     jac: array([2.67323741e-05, 1.76854178e-03, 1.64489142e-03])
 message: 'Optimization terminated successfully.'
    nfev: 73
    nhev: 0
     nit: 29
    njev: 204
  status: 0
 success: True
       x: array([-25.16376776,   0.20625197,   0.20149048])
用训练集预测和验证
def predict(x, theta):
    prob = sigmoid(x @ theta)
    return (prob >= 0.5).astype(int) # 实现变量类型转换
TP = True Postive = 真阳性
FP = False Postive = 假阳性
FN = False Negative = 假阴性
TN = True Negative = 真阴性
precison表示精度= T P T P + F P \frac{TP}{TP+FP} TP+FPTP
recall表示召回率或者敏感度 s e n s i t i v i t y = T P T P + F N sensitivity=\frac {TP}{TP+FN} sensitivity=TP+FNTP
f1-score表示精度和敏感度的求和
macro avg 表示宏平均,表示所有类别对应指标的平均值
weighted avg 表示带权重平均,即类别样本占总样本的比重与对应指标的乘积的累加和
在二分类场景中,正标签的召回率称为敏感度(sensitivity),负标签的召回率称为特异性(specificity)
final_theta = res.x
y_pred = predict(X, final_theta)

print(classification_report(y, y_pred))
              precision    recall  f1-score   support

           0       0.87      0.85      0.86        40
           1       0.90      0.92      0.91        60

    accuracy                           0.89       100
   macro avg       0.89      0.88      0.88       100
weighted avg       0.89      0.89      0.89       100
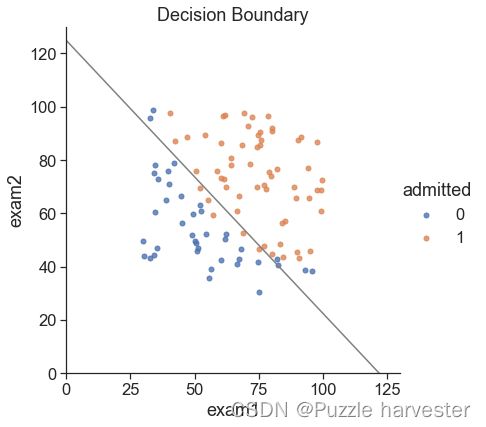
寻找决策边界
X × θ = 0 X\times\theta=0 X×θ=0 (this is the line)
print(res.x) # this is final theta
[-25.16376776 0.20625197 0.20149048]
coef = -(res.x / res.x[2]) # find the equation
print(coef)

x = np.arange(130, step = 0.1)
y = coef[0] + coef[1] * x
[124.88812168 -1.02363132 -1. ]
data.describe() # find the range of x and y
| exam1 | exam2 | admitted | |
|---|---|---|---|
| count | 100.000000 | 100.000000 | 100.000000 |
| mean | 65.644274 | 66.221998 | 0.600000 |
| std | 19.458222 | 18.582783 | 0.492366 |
| min | 30.058822 | 30.603263 | 0.000000 |
| 25% | 50.919511 | 48.179205 | 0.000000 |
| 50% | 67.032988 | 67.682381 | 1.000000 |
| 75% | 80.212529 | 79.360605 | 1.000000 |
| max | 99.827858 | 98.869436 | 1.000000 |
sns.set(context = "notebook", style = "ticks", font_scale = 1.5) # 默认使用notebook上下文 主题 context可以设置输出图片的大小尺寸(scale)

sns.lmplot('exam1', 'exam2', hue = 'admitted', data = data,
           height = 6,
          fit_reg = False,
          scatter_kws = {"s":25})
plt.plot(x, y, 'grey')
plt.xlim(0, 130)
plt.ylim(0, 130)
plt.title('Decision Boundary')
plt.show()
3 - 正则化逻辑回归
df = pd.read_csv('ex2data2.txt', names = ['test1', 'test2', 'accepted'])
df.head()
| test1 | test2 | accepted | |
|---|---|---|---|
| 0 | 0.051267 | 0.69956 | 1 |
| 1 | -0.092742 | 0.68494 | 1 |
| 2 | -0.213710 | 0.69225 | 1 |
| 3 | -0.375000 | 0.50219 | 1 |
| 4 | -0.513250 | 0.46564 | 1 |
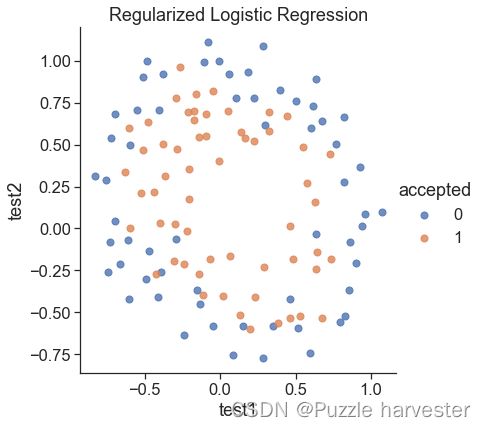
sns.set(context="notebook", style="ticks", font_scale = 1.5)
sns.lmplot('test1', 'test2', hue = 'accepted', data = df,
          height = 6,
          fit_reg = False,
          scatter_kws = {"s":50})
plt.title("Regularized Logistic Regression")
plt.show()
feature mapping (特征映射)
polynomial expansion
for i in 0…i
for p in 0…i:
output x^(i-p) * y^p
def feature_mapping(x, y, power, as_ndarray = False):
    data = {
        "f{}{}".format(i - p, p):np.power(x, i - p) * np.power(y, p)
        for i in np.arange(power + 1)
        for p in np.arange(i + 1)
    }
    if as_ndarray == True:
        return pd.DataFrame(data).values # 转换为列表
    else :
        return pd.DataFrame(data)
x1 = np.array(df.test1)
x2 = np.array(df.test2)
data = feature_mapping(x1, x2, power = 6)
print(data.shape)
data.head()
(118, 28)
| f00 | f10 | f01 | f20 | f11 | f02 | f30 | f21 | f12 | f03 | ... | f23 | f14 | f05 | f60 | f51 | f42 | f33 | f24 | f15 | f06 | |
|---|---|---|---|---|---|---|---|---|---|---|---|---|---|---|---|---|---|---|---|---|---|
| 0 | 1.0 | 0.051267 | 0.69956 | 0.002628 | 0.035864 | 0.489384 | 0.000135 | 0.001839 | 0.025089 | 0.342354 | ... | 0.000900 | 0.012278 | 0.167542 | 1.815630e-08 | 2.477505e-07 | 0.000003 | 0.000046 | 0.000629 | 0.008589 | 0.117206 |
| 1 | 1.0 | -0.092742 | 0.68494 | 0.008601 | -0.063523 | 0.469143 | -0.000798 | 0.005891 | -0.043509 | 0.321335 | ... | 0.002764 | -0.020412 | 0.150752 | 6.362953e-07 | -4.699318e-06 | 0.000035 | -0.000256 | 0.001893 | -0.013981 | 0.103256 |
| 2 | 1.0 | -0.213710 | 0.69225 | 0.045672 | -0.147941 | 0.479210 | -0.009761 | 0.031616 | -0.102412 | 0.331733 | ... | 0.015151 | -0.049077 | 0.158970 | 9.526844e-05 | -3.085938e-04 | 0.001000 | -0.003238 | 0.010488 | -0.033973 | 0.110047 |
| 3 | 1.0 | -0.375000 | 0.50219 | 0.140625 | -0.188321 | 0.252195 | -0.052734 | 0.070620 | -0.094573 | 0.126650 | ... | 0.017810 | -0.023851 | 0.031940 | 2.780914e-03 | -3.724126e-03 | 0.004987 | -0.006679 | 0.008944 | -0.011978 | 0.016040 |
| 4 | 1.0 | -0.513250 | 0.46564 | 0.263426 | -0.238990 | 0.216821 | -0.135203 | 0.122661 | -0.111283 | 0.100960 | ... | 0.026596 | -0.024128 | 0.021890 | 1.827990e-02 | -1.658422e-02 | 0.015046 | -0.013650 | 0.012384 | -0.011235 | 0.010193 |
5 rows × 28 columns
data.describe()
| f00 | f10 | f01 | f20 | f11 | f02 | f30 | f21 | f12 | f03 | ... | f23 | f14 | f05 | f60 | f51 | f42 | f33 | f24 | f15 | f06 | |
|---|---|---|---|---|---|---|---|---|---|---|---|---|---|---|---|---|---|---|---|---|---|
| count | 118.0 | 118.000000 | 118.000000 | 118.000000 | 118.000000 | 118.000000 | 1.180000e+02 | 118.000000 | 118.000000 | 118.000000 | ... | 118.000000 | 1.180000e+02 | 118.000000 | 1.180000e+02 | 118.000000 | 1.180000e+02 | 118.000000 | 1.180000e+02 | 118.000000 | 1.180000e+02 |
| mean | 1.0 | 0.054779 | 0.183102 | 0.247575 | -0.025472 | 0.301370 | 5.983333e-02 | 0.030682 | 0.015483 | 0.142350 | ... | 0.018278 | 4.089084e-03 | 0.115710 | 7.837118e-02 | -0.000703 | 1.893340e-02 | -0.001705 | 2.259170e-02 | -0.006302 | 1.257256e-01 |
| std | 0.0 | 0.496654 | 0.519743 | 0.248532 | 0.224075 | 0.284536 | 2.746459e-01 | 0.134706 | 0.150143 | 0.326134 | ... | 0.058513 | 9.993907e-02 | 0.299092 | 1.938621e-01 | 0.058271 | 3.430092e-02 | 0.037443 | 4.346935e-02 | 0.090621 | 2.964416e-01 |
| min | 1.0 | -0.830070 | -0.769740 | 0.000040 | -0.484096 | 0.000026 | -5.719317e-01 | -0.358121 | -0.483743 | -0.456071 | ... | -0.142660 | -4.830370e-01 | -0.270222 | 6.472253e-14 | -0.203971 | 2.577297e-10 | -0.113448 | 2.418097e-10 | -0.482684 | 1.795116e-14 |
| 25% | 1.0 | -0.372120 | -0.254385 | 0.043243 | -0.178209 | 0.061086 | -5.155632e-02 | -0.023672 | -0.042980 | -0.016492 | ... | -0.001400 | -7.449462e-03 | -0.001072 | 8.086369e-05 | -0.006381 | 1.258285e-04 | -0.005749 | 3.528590e-04 | -0.016662 | 2.298277e-04 |
| 50% | 1.0 | -0.006336 | 0.213455 | 0.165397 | -0.016521 | 0.252195 | -2.544062e-07 | 0.006603 | -0.000039 | 0.009734 | ... | 0.001026 | -8.972096e-09 | 0.000444 | 4.527344e-03 | -0.000004 | 3.387050e-03 | -0.000005 | 3.921378e-03 | -0.000020 | 1.604015e-02 |
| 75% | 1.0 | 0.478970 | 0.646563 | 0.389925 | 0.100795 | 0.464189 | 1.099616e-01 | 0.086392 | 0.079510 | 0.270310 | ... | 0.021148 | 2.751341e-02 | 0.113020 | 5.932959e-02 | 0.002104 | 2.090875e-02 | 0.001024 | 2.103622e-02 | 0.001289 | 1.001215e-01 |
| max | 1.0 | 1.070900 | 1.108900 | 1.146827 | 0.568307 | 1.229659 | 1.228137e+00 | 0.449251 | 0.505577 | 1.363569 | ... | 0.287323 | 4.012965e-01 | 1.676725 | 1.508320e+00 | 0.250577 | 2.018260e-01 | 0.183548 | 2.556084e-01 | 0.436209 | 1.859321e+00 |
8 rows × 28 columns
regularized cost (正则化代价函数)
J ( θ ) = 1 m ∑ i = 1 m [ − y ( i ) log ( h θ ( x ( i ) ) ) − ( 1 − y ( i ) ) log ( 1 − h θ ( x ( i ) ) ) ] + λ 2 m ∑ j = 1 n θ j 2 J(\theta)=\frac {1}{m}\sum_{i=1}^m[-y^{(i)}\log(h_\theta(x^{(i)}))-(1-y^{(i)})\log(1-h_\theta(x^{(i)}))]+\frac {\lambda}{2m}\sum_{j=1}^{n}\theta_j^2 J(θ)=m1i=1∑m[−y(i)log(hθ(x(i)))−(1−y(i))log(1−hθ(x(i)))]+2mλj=1∑nθj2
theta = np.zeros(data.shape[1])
X = feature_mapping(x1, x2, power = 6, as_ndarray = True)
print(X.shape)

y = get_y(df)
print(y.shape)
(118, 28)
(118,)
def regularized_cost(theta, X, y, l = 1):
    theta_j1_to_n = theta[1:] # 去掉偏置项
    regularized_term = (l / (2 * len(X))) * np.power(theta_j1_to_n, 2).sum()

    return cost(theta, X, y) + regularized_term
regularized_cost(theta, X, y, l = 1)
0.6931471805599454
因为我们设置theta为0,所以这个正则化代价函数与代价函数的值应该相同
regularized gradient(正则化梯度)
∂ J ( θ ) ∂ θ j = ( 1 m ∑ i = 1 m ( h θ ( x ( i ) ) − y ( i ) ) ) + λ m θ j f o r j ≥ 1 \frac {\partial J(\theta)}{\partial\theta_j}=(\frac {1}{m}\sum_{i=1}^{m}(h_\theta(x^{(i)})-y{(i)}))+\frac {\lambda}{m}\theta_j for j\geq 1 ∂θj∂J(θ)=(m1i=1∑m(hθ(x(i))−y(i)))+mλθjforj≥1
def regularized_gradient(theta, X, y, l = 1):
    theta_j1_to_n = theta[1:]  # 不加theta0
    regularized_theta = (l / len(X)) * theta_j1_to_n

    regularized_term = np.concatenate([np.array([0]), regularized_theta]) # concatenate()拼接函数
    return gradient(theta, X, y) + regularized_term
regularized_gradient(theta, X, y)
array([8.47457627e-03, 1.87880932e-02, 7.77711864e-05, 5.03446395e-02,
       1.15013308e-02, 3.76648474e-02, 1.83559872e-02, 7.32393391e-03,
       8.19244468e-03, 2.34764889e-02, 3.93486234e-02, 2.23923907e-03,
       1.28600503e-02, 3.09593720e-03, 3.93028171e-02, 1.99707467e-02,
       4.32983232e-03, 3.38643902e-03, 5.83822078e-03, 4.47629067e-03,
       3.10079849e-02, 3.10312442e-02, 1.09740238e-03, 6.31570797e-03,
       4.08503006e-04, 7.26504316e-03, 1.37646175e-03, 3.87936363e-02])
拟合参数
import scipy.optimize as opt
print("init cost = {}".format(regularized_cost(theta, X, y)))

res = opt.minimize(fun = regularized_cost, x0 = theta, args = (X, y), method = 'Newton-CG', jac = regularized_gradient)
res
init cost = 0.6931471805599454


     fun: 0.5290027297127309
     jac: array([-1.02331192e-07,  1.16573581e-08, -1.13146499e-08, -5.93330905e-08,
        1.53518404e-08, -6.11006109e-10,  3.69153733e-08, -3.78360557e-08,
        5.91349666e-10,  1.37418341e-08, -8.99546470e-08, -1.57424741e-08,
       -6.48324154e-08,  5.57567212e-10, -1.90760313e-08,  1.60874750e-08,
       -2.11863353e-08, -2.18643583e-08, -2.08393162e-08,  1.19810268e-09,
        1.12326493e-08, -5.55427231e-08, -7.37101448e-09, -3.39415835e-08,
       -1.24524922e-08, -3.00944173e-08,  1.68739636e-09, -2.60310344e-08])
 message: 'Optimization terminated successfully.'
    nfev: 7
    nhev: 0
     nit: 6
    njev: 55
  status: 0
 success: True
       x: array([ 1.27273931,  0.62527071,  1.18108886, -2.01995872, -0.9174234 ,
       -1.4316643 ,  0.124007  , -0.36553405, -0.3572397 , -0.17513026,
       -1.45815722, -0.05098967, -0.61555642, -0.27470644, -1.19281693,
       -0.24218778, -0.20600596, -0.04473156, -0.27778467, -0.29537803,
       -0.45635728, -1.04320291,  0.02777149, -0.29243207,  0.01556634,
       -0.32738023, -0.14388695, -0.92465347])
预测
final_theta = res.x
y_pred = predict(X, final_theta)

print(classification_report(y, y_pred))
              precision    recall  f1-score   support

           0       0.90      0.75      0.82        60
           1       0.78      0.91      0.84        58

    accuracy                           0.83       118
   macro avg       0.84      0.83      0.83       118
weighted avg       0.84      0.83      0.83       118
使用不同的 λ \lambda λ(这个是常数)
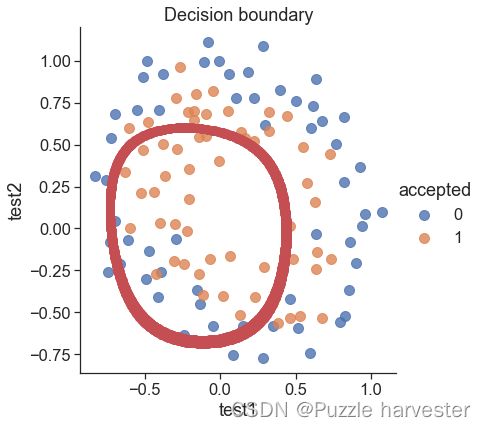
画出决策边界
- 我们找到所有满足 X × θ = 0 X \times \theta = 0 X×θ=0的x
- instead of solving polynomial equation,just create a coridate x,y grid that is dense enough,and find all those X × θ X \times \theta X×θ that is close enough to 0, then plot them.
def draw_boundary(power, l):
    '''
    power:维度
    l:lambda

    '''
    density = 1000
    threshhold = 2 * 10**-3

    final_theta = feature_mapping_logistic_regression(power, l)
    x, y = find_decision_boundary(density, power,final_theta, threshhold)

    df = pd.read_csv('ex2data2.txt', names = ['test1', 'test2', 'accepted'])
    sns.lmplot('test1', 'test2', hue = 'accepted', data = df,
              height = 6,
              fit_reg = False,
              scatter_kws = {"s":100})

    plt.scatter(x, y,c = 'r', s = 10) # 画出分界线上的点
    plt.title('Decision boundary')
    plt.show()
def feature_mapping_logistic_regression(power, l):
    df = pd.read_csv('ex2data2.txt', names = ['test1', 'test2', 'accepted'])
    x1 = np.array(df.test1)
    x2 = np.array(df.test2)
    y = get_y(df)

    X = feature_mapping(x1, x2, power, as_ndarray = True)
    theta = np.zeros(X.shape[1])

    res = opt.minimize(fun = regularized_cost, x0 = theta, args = (X, y, l),method = 'TNC', jac = regularized_gradient)
    final_theta = res.x
    return final_theta
zip()函数:
a = [1,2,3]
b = [4,5,6]
c = [4,5,6,7,8]
zipped = zip(a,b) # 打包为元组的列表
[(1, 4), (2, 5), (3, 6)]
zip(a,c) # 元素个数与最短的列表一致
[(1, 4), (2, 5), (3, 6)]
zip(*zipped) # 与 zip 相反,*zipped 可理解为解压,返回二维矩阵式
[(1, 2, 3), (4, 5, 6)]
def find_decision_boundary(density, power, theta, threshhold):
    t1 = np.linspace(-1, 1.5, density) # 1000个样本
    t2 = np.linspace(-1, 1.5, density)

    cordinates = [(x, y) for x in t1 for y in t2]
    x_cord, y_cord = zip( * cordinates)
    mapped_cord = feature_mapping(x_cord, y_cord, power) # this is a datafraze

    inner_product = mapped_cord.values @ theta

    decision = mapped_cord[np.abs(inner_product) < threshhold]

    return decision.f10, decision.f01
# 寻找决策边界函数
改变 λ \lambda λ的值,查看效果(选做)
draw_boundary(power = 6, l = 1) # 设置lambda = 1
draw_boundary(power = 6, l = 0) # 设置lambda <= 0.1,过拟合
draw_boundary(power = 6, l = 100) # 设置lambda > 10,欠拟合


