吴恩达|机器学习作业2.0Logistic 回归
2.0.Logistic 回归
1)题目:
在本部分的练习中,您将使用Logistic回归模型来预测一个学生是否被大学录取。假设你是大学某个院系的管理员,你想通过申请人在两门考试中的表现来决定每个人的录取率,你有来自以前申请人的历史数据,你可以用这些数据作为训练集建立Logistic回归,对每一个训练样本,你有申请人在两门考试中的分数和录取决定。
你的任务是建立一个分类模型,基于这两门课的分数来估计申请人的录取概率。
数据链接: https://pan.baidu.com/s/1-u0iDFDibZc6tTGGx9_wnQ 提取码: 351j
2)知识点概括:
- Logistic回归虽然名叫回归,但实际是一种分类算法。
它的假设函数 h θ ( x ) = 1 1 + e − θ T x h_\theta(x)={1\over 1+e^{-\theta^Tx}} hθ(x)=1+e−θTx1的估计值表示了输入值x的条件下得到y=1的概率,即该样例为正类的概率,即 h θ ( x ) = P ( y = 1 ∣ x ; θ ) h_\theta(x)=P(y=1|x;\theta) hθ(x)=P(y=1∣x;θ) - θ T x = 0 \theta^Tx=0 θTx=0称为决策边界(decision boundary)即对应了 h θ ( x ) = 0.5 h_\theta(x)=0.5 hθ(x)=0.5,它不是训练集的属性,而是假设本身及其参数的属性。若阈值为0.5,则 y = 1 y=1 y=1的区域为 θ T x > 0 \theta^Tx>0 θTx>0,反之 y = 0 y=0 y=0的区域为 θ T x < 0 \theta^Tx<0 θTx<0。
- 代价函数(cost function)为 J ( θ ) = 1 m ∑ i = 1 m C o s t ( h θ ( x ( i ) ) , y ( i ) ) = − 1 m ∑ i = 1 m [ y ( i ) l o g h θ ( x ( i ) ) + ( 1 − y ( i ) ) l o g ( 1 − h θ ( x ( i ) ) ) ] J(\theta)={1\over m}\sum_{i=1}^mCost(h_\theta(x^{(i)}),y^{(i)})=-{1\over m}\sum_{i=1}^m[y^{(i)}logh_\theta(x^{(i)})+(1-y^{(i)})log(1-h_\theta(x^{(i)}))] J(θ)=m1∑i=1mCost(hθ(x(i)),y(i))=−m1∑i=1m[y(i)loghθ(x(i))+(1−y(i))log(1−hθ(x(i)))]
- 梯度(gradient)为 ∂ ∂ θ j J ( θ ) = 1 m ∑ i = 1 m ( h θ ( x ( i ) ) − y ( i ) ) x j ( i ) {\partial \over \partial\theta_j}J(\theta)={1\over m}\sum_{i=1}^m(h_\theta(x^{(i)})-y^{(i)})x_j^{(i)} ∂θj∂J(θ)=m1∑i=1m(hθ(x(i))−y(i))xj(i)
3)大致步骤:
首先用pandas读取数据,数据处理好之后用.values转化为矩阵进行运算,然后可视化训练集数据,定义sigmoid函数、代价函数和梯度,带入更高级的算法中自动优化求解参数。
这里Ng推荐的算法有:共轭梯度法(conjugate gradient)、拟牛顿法(BFGS、L-BFGS)。
然后再进行对给定的某名学生的录取概率进行预测,并计算该分类器的精度、查准率和查全率。最后画出决策边界。
4)关于Python:
scipy中的optimize子包中提供了常用的最优化算法函数实现。我们可以直接调用这些函数完成我们的优化问题。具体可参考:
http://blog.sina.com.cn/s/blog_5f234d4701013ln6.html
本次练习主要采用了拟牛顿法、牛顿共轭梯度法和L-BFGS-B,其中需要输入目标函数、theta初始值、目标函数的梯度、最大迭代次数、传递给函数和梯度的值、并设置其他输出full_output=True(注意fmin_bfgs、fmin_ncg与fmin_l_bfgs_b参数不同,前两个需要选择full_output才可以返回优化的最小值,而fmin_l_bfgs_b默认返回)。
5)代码和结果:
import numpy as np
import pandas as pd
import matplotlib.pyplot as plt
import scipy.optimize as opt

data = pd.read_csv('ex2data1.txt', sep=',', names=['score1', 'score2', 'admission'])
(m, n) = data.shape
#截取并转化为矩阵
x = data[['score1', 'score2']]
x1 = pd.DataFrame(np.ones((m,1)), columns=['constant']) #在前面赋值一列1
x = pd.concat([x1, x], axis=1) #合并dataframe
y = data['admission'].astype(float) #y是int的需要转化为浮点型

x = x.values #从数据框转化为矩阵
y = y.values
theta = np.zeros(n) #赋值theta

'''可视化训练集数据'''
def plotData(data):
    positive = data[data.admission==1] #筛选出y=1的部分
    negative = data[data.admission==0]
    plt.scatter(positive.score1, positive.score2, c='k', marker='+', label='Admitted')
    plt.scatter(negative.score1, negative.score2, c='y', marker='o', label='Not Admitted')
    plt.legend(loc=1)
    plt.xlabel('Exam1 Score')
    plt.ylabel('Exam2 Score')

plt.figure(0)
plotData(data)

'''sigmoid函数'''
def sigmoid(x):
    return 1/(1+np.exp(-x))

'''计算代价函数和梯度'''
#代价函数
def cost_func(theta, x, y):
    m = y.size
    return -1/m*([email protected](sigmoid(x@theta))+(1-y)@np.log(1-sigmoid(x@theta)))

#梯度
def gradient_func(theta, x, y):
    m = y.size
    return 1/m*((sigmoid(x@theta))-y).T@x


'''求解最优参数'''
#方法一 BFGS
theta1, cost1, *unused1 = opt.fmin_bfgs(f=cost_func, fprime=gradient_func, x0=theta, args=(x, y), maxiter=400, full_output=True)

#方法二 牛顿共轭梯度
theta2, cost2, *unused2 = opt.fmin_ncg(f=cost_func, fprime=gradient_func, x0=theta, args=(x, y), maxiter=400, full_output=True)

#方法三 L-BFGS-B
theta3, cost3, *unused3 = opt.fmin_l_bfgs_b(func=cost_func, fprime=gradient_func, x0=theta, args=(x, y), maxiter=400)


'''预测与模型评价'''
#预测录取改率
def predict(x, theta):
    return sigmoid(x@theta)

x_test = [1, 45, 85]
print('The admission probabilities are %.4f  %.4f  %.4f respectively' %(predict(x_test, theta1),predict(x_test, theta2),predict(x_test, theta3)))

#阈值取0.5时的预测样例,即输出是正例还是反例
def p_or_n(theta, x=x):
    a = predict(x, theta)
    for i in range(a.size):
        if a[i]<0.5:
            a[i]=0
        else:
            a[i]=1
    return a

#精度
def accuracy(theta, x=x, y=y):
    m = y.size
    return 1-np.sum(np.abs(y-p_or_n(theta)))/m

#查准率
def precision(theta, x=x, y=y):
    p_p = pd.DataFrame((y+p_or_n(theta))) #转换成dataframe来计数,真正例预测也为正例
    return np.sum(p_p==2)/np.sum(p_or_n(theta)) #预测的正例中真实正例的比例

#查全率
def recall(theta, x=x, y=y):
    p_p = pd.DataFrame((y+p_or_n(theta))) #转换成dataframe来计数,真正例预测也为正例
    return np.sum(p_p==2)/np.sum(y) #真实正例中被预测为正例的比例

for i in range(1,4):
    print(accuracy(locals()['theta'+str(i)])) #变量名循环,依次打印精度

for i in range(1,4):
    print(precision(locals()['theta'+str(i)])) #变量名循环,依次打印查准率

for i in range(1,4):
    print(recall(locals()['theta'+str(i)])) #变量名循环,依次打印查全率


'''画出决策边界'''
#x@theta=0为决策边界,即theta[0]*1+theta[1]*x[1]+theta[2]*x[2]=0
def plotBD(theta,method,color):
    x1 = np.arange(25, 100, step=0.1)
    x2 = -(theta[0]+theta[1]*x1)/theta[2]
    plt.plot(x1, x2, label=method, c=color)
    plt.legend(loc=3)
    plt.title('The Decision Boundary')

plt.figure(1)
plotData(data)
plotBD(theta1,'BFGS','g')
plotBD(theta2,'NCG','r')
plotBD(theta3,'L-BFGS-B','b')
plt.show
BFGS、牛顿共轭梯度、L-BFGS-B的迭代次数分别为23、26和27。
三种方法所求的最优参数和最后的代价函数值分别为

![]()
三种方法预测的成绩分别为45、85的学生的录取概率为(期望值为0.776)
![]()
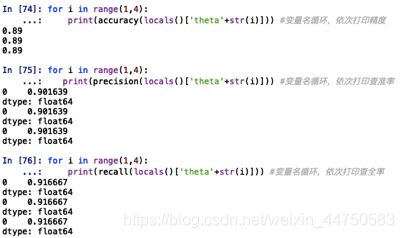
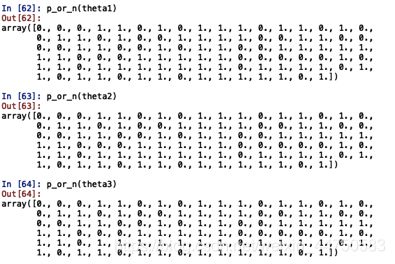
虽然从代价函数和单个学生的录取概率准确性来说,第二种方法即牛顿共轭梯度不如拟牛顿表现好,但是当阈值取0.5时,三种方法的精度(0.89)、查准率(0.901639)、查全率(0.916667)完全相同,且仔细查看后发现他们虽然对每个训练集的预测录取概率有所差别,但是在阈值0.5下所产生的预测正反例完全一样。

三种方法预测的正反例矩阵一样:

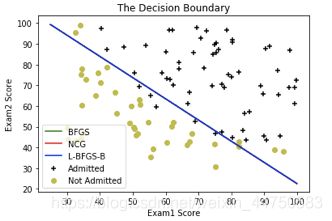
自然三种方法的决策边界也一样:
