使用LSTM预测股票数据
数据集:股票数据集.
数据集来源::https://www.kaggle.com/dsadads/databases
1 加载数据集
import numpy as np
import pandas as pd
import datetime
stock = pd.read_csv('dataset/SH600519.csv')
stock_data = pd.read_csv('dataset/SH600519.csv')
stock_data.set_index(['date'], inplace=True)
stock_data
| Unnamed: 0 | open | close | high | low | volume | code | |
|---|---|---|---|---|---|---|---|
| date | |||||||
| 2010-04-26 | 74 | 88.702 | 87.381 | 89.072 | 87.362 | 107036.13 | 600519 |
| 2010-04-27 | 75 | 87.355 | 84.841 | 87.355 | 84.681 | 58234.48 | 600519 |
| 2010-04-28 | 76 | 84.235 | 84.318 | 85.128 | 83.597 | 26287.43 | 600519 |
| 2010-04-29 | 77 | 84.592 | 85.671 | 86.315 | 84.592 | 34501.20 | 600519 |
| 2010-04-30 | 78 | 83.871 | 82.340 | 83.871 | 81.523 | 85566.70 | 600519 |
| ... | ... | ... | ... | ... | ... | ... | ... |
| 2020-04-20 | 2495 | 1221.000 | 1227.300 | 1231.500 | 1216.800 | 24239.00 | 600519 |
| 2020-04-21 | 2496 | 1221.020 | 1200.000 | 1223.990 | 1193.000 | 29224.00 | 600519 |
| 2020-04-22 | 2497 | 1206.000 | 1244.500 | 1249.500 | 1202.220 | 44035.00 | 600519 |
| 2020-04-23 | 2498 | 1250.000 | 1252.260 | 1265.680 | 1247.770 | 26899.00 | 600519 |
| 2020-04-24 | 2499 | 1248.000 | 1250.560 | 1259.890 | 1235.180 | 19122.00 | 600519 |
2426 rows × 7 columns
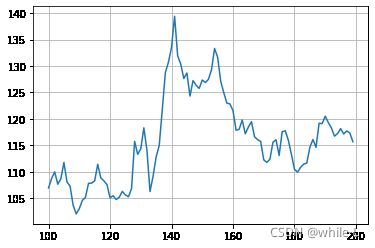
2 绘制收盘价图
import matplotlib.pyplot as plt
from matplotlib import ticker # 调整坐标轴
from matplotlib.pylab import date2num # 日期转换
stock = stock[100:200]
stock['close'].plot(grid = True)
3 计算涨跌幅
stock_data.shape[0]
2426
stock_data.iloc[101:102,].values
array([[1.75000e+02, 1.06990e+02, 1.08749e+02, 1.08858e+02, 1.06475e+02,
        1.85480e+04, 6.00519e+05]])
quote_change = []
for i in range(stock_data.shape[0]):
    if (i == 0):
        quote_change.append(0)
    else:
        today = stock_data.iloc[(i,1)]
        yestaday = stock_data.iloc[(i-1,1)]
        quote = (today - yestaday)/yestaday
        quote_change.append(np.array(quote,dtype=np.float))
stock_data['quote_change'] = quote_change
stock_data
| Unnamed: 0 | open | close | high | low | volume | code | quote_change | |
|---|---|---|---|---|---|---|---|---|
| date | ||||||||
| 2010-04-26 | 74 | 88.702 | 87.381 | 89.072 | 87.362 | 107036.13 | 600519 | 0 |
| 2010-04-27 | 75 | 87.355 | 84.841 | 87.355 | 84.681 | 58234.48 | 600519 | -0.015185677887758948 |
| 2010-04-28 | 76 | 84.235 | 84.318 | 85.128 | 83.597 | 26287.43 | 600519 | -0.03571632991815013 |
| 2010-04-29 | 77 | 84.592 | 85.671 | 86.315 | 84.592 | 34501.20 | 600519 | 0.00423814328960645 |
| 2010-04-30 | 78 | 83.871 | 82.340 | 83.871 | 81.523 | 85566.70 | 600519 | -0.008523264611310805 |
| ... | ... | ... | ... | ... | ... | ... | ... | ... |
| 2020-04-20 | 2495 | 1221.000 | 1227.300 | 1231.500 | 1216.800 | 24239.00 | 600519 | 0.00909090909090909 |
| 2020-04-21 | 2496 | 1221.020 | 1200.000 | 1223.990 | 1193.000 | 29224.00 | 600519 | 1.6380016380001484e-05 |
| 2020-04-22 | 2497 | 1206.000 | 1244.500 | 1249.500 | 1202.220 | 44035.00 | 600519 | -0.012301190807685363 |
| 2020-04-23 | 2498 | 1250.000 | 1252.260 | 1265.680 | 1247.770 | 26899.00 | 600519 | 0.03648424543946932 |
| 2020-04-24 | 2499 | 1248.000 | 1250.560 | 1259.890 | 1235.180 | 19122.00 | 600519 | -0.0016 |
2426 rows × 8 columns
20天最大涨幅的计算
len(stock_data)
2426
封装成函数
def up(min_data ,i , m):
    if(min_data > stock_data.iloc[i - m,1]):
        min_data = stock_data.iloc[i - m,1]
    return min_data
def down(min_data,i,k):
    if(min_data > stock_data.iloc[(i + k,1)]):
        min_data = stock_data.iloc[(i + k,1)]
    return min_data
sequence = 20

new_feature = []

for i in range(stock_data.shape[0]):
    min_data = stock_data.iloc[i,1]
    # 当i<10时,向上寻找i中最小值 向下寻找十天的最小值
    if (i < 10):
        for m in range(i):
            min_data = up(min_data ,i ,m)
        for k in range(10):
            min_data = down(min_data,i,k)
    if (i > (stock.shape[0]-10)):
        for j in range(10):
            min_data = up(min_data ,i ,j)
        for n in range(stock.shape[0]-i):
            min_data = down(min_data,i,n)
    else:
        for j in range(10):
            min_data = up(min_data,i,j)
        for k in range(10):
            min_data = down(min_data,i,k)

    new_feature.append(np.array((stock_data.iloc[(i,1)]-min_data)/min_data,dtype=np.float))
直接求
sequence = 20

new_feature = []

for i in range(stock_data.shape[0]):
    min_data = stock_data.iloc[i,1]
    # 当i<10时,向上寻找i中最小值 向下寻找十天的最小值
    if (i < 10):
        for m in range(i):
            if(min_data > stock_data.iloc[i-m,1]):
                min_data = stock_data.iloc[i-m,1]
        for k in range(10):
            if(min_data > stock_data.iloc[(i + k,1)]):
                min_data = stock_data.iloc[(i + k,1)]
    if (i > (stock.shape[0]-10)):
        for j in range(10):
            if(min_data > stock_data.iloc[(i - j,1)]):
                min_data = stock_data.iloc[(i - j,1)]
        for n in range(stock.shape[0]-i):
             if(min_data > stock_data.iloc[(i + n,1)]):
                min_data = stock_data.iloc[(i + n,1)]
    else:
        for j in range(10):
            if(min_data > stock_data.iloc[(i - j,1)]):
                min_data = stock_data.iloc[(i - j,1)]
        for k in range(10):
            if(min_data > stock_data.iloc[(i + k,1)]):
                min_data = stock_data.iloc[(i + k,1)]

    new_feature.append(np.array((stock_data.iloc[(i,1)]-min_data)/min_data,dtype=np.float))
new_feature
len(new_feature)
2426
stock_data['max_increase'] = new_feature
stock_data
| Unnamed: 0 | open | close | high | low | volume | code | quote_change | max_increase | |
|---|---|---|---|---|---|---|---|---|---|
| date | |||||||||
| 2010-04-26 | 74 | 88.702 | 87.381 | 89.072 | 87.362 | 107036.13 | 600519 | 0 | 0.10317637987214874 |
| 2010-04-27 | 75 | 87.355 | 84.841 | 87.355 | 84.681 | 58234.48 | 600519 | -0.015185677887758948 | 0.08642389871402628 |
| 2010-04-28 | 76 | 84.235 | 84.318 | 85.128 | 83.597 | 26287.43 | 600519 | -0.03571632991815013 | 0.0476208243165932 |
| 2010-04-29 | 77 | 84.592 | 85.671 | 86.315 | 84.592 | 34501.20 | 600519 | 0.00423814328960645 | 0.052060791483222554 |
| 2010-04-30 | 78 | 83.871 | 82.340 | 83.871 | 81.523 | 85566.70 | 600519 | -0.008523264611310805 | 0.043093798970225965 |
| ... | ... | ... | ... | ... | ... | ... | ... | ... | ... |
| 2020-04-20 | 2495 | 1221.000 | 1227.300 | 1231.500 | 1216.800 | 24239.00 | 600519 | 0.00909090909090909 | 0.059895833333333336 |
| 2020-04-21 | 2496 | 1221.020 | 1200.000 | 1223.990 | 1193.000 | 29224.00 | 600519 | 1.6380016380001484e-05 | 0.05991319444444443 |
| 2020-04-22 | 2497 | 1206.000 | 1244.500 | 1249.500 | 1202.220 | 44035.00 | 600519 | -0.012301190807685363 | 0.04155871074722759 |
| 2020-04-23 | 2498 | 1250.000 | 1252.260 | 1265.680 | 1247.770 | 26899.00 | 600519 | 0.03648424543946932 | 0.07955919438974668 |
| 2020-04-24 | 2499 | 1248.000 | 1250.560 | 1259.890 | 1235.180 | 19122.00 | 600519 | -0.0016 | 0.07124463519313305 |
2426 rows × 9 columns
选择use_cols作为特征
#X.append(np.array(stock_data.iloc[i:(i+sequence),].values, dtype=np.float))
# label 取当前日期后的30天收盘价涨幅
#y.append(np.array(stock_data.iloc[(i + sequence,5)],dtype=np.float))
4 归一化
sklearn
from sklearn.preprocessing import MinMaxScaler
# stock_data = stock_data[2000:2420]
columns = ['open','close','high','low','volume','quote_change','max_increase']
stock_data = stock_data[columns]
stock_data
| open | close | high | low | volume | quote_change | max_increase | |
|---|---|---|---|---|---|---|---|
| date | |||||||
| 2010-04-26 | 88.702 | 87.381 | 89.072 | 87.362 | 107036.13 | 0 | 0.10317637987214874 |
| 2010-04-27 | 87.355 | 84.841 | 87.355 | 84.681 | 58234.48 | -0.015185677887758948 | 0.08642389871402628 |
| 2010-04-28 | 84.235 | 84.318 | 85.128 | 83.597 | 26287.43 | -0.03571632991815013 | 0.0476208243165932 |
| 2010-04-29 | 84.592 | 85.671 | 86.315 | 84.592 | 34501.20 | 0.00423814328960645 | 0.052060791483222554 |
| 2010-04-30 | 83.871 | 82.340 | 83.871 | 81.523 | 85566.70 | -0.008523264611310805 | 0.043093798970225965 |
| ... | ... | ... | ... | ... | ... | ... | ... |
| 2020-04-20 | 1221.000 | 1227.300 | 1231.500 | 1216.800 | 24239.00 | 0.00909090909090909 | 0.059895833333333336 |
| 2020-04-21 | 1221.020 | 1200.000 | 1223.990 | 1193.000 | 29224.00 | 1.6380016380001484e-05 | 0.05991319444444443 |
| 2020-04-22 | 1206.000 | 1244.500 | 1249.500 | 1202.220 | 44035.00 | -0.012301190807685363 | 0.04155871074722759 |
| 2020-04-23 | 1250.000 | 1252.260 | 1265.680 | 1247.770 | 26899.00 | 0.03648424543946932 | 0.07955919438974668 |
| 2020-04-24 | 1248.000 | 1250.560 | 1259.890 | 1235.180 | 19122.00 | -0.0016 | 0.07124463519313305 |
2426 rows × 7 columns
scaler = MinMaxScaler()
stock_scaler = scaler.fit_transform(stock_data)
stock_scaler = pd.DataFrame(stock_scaler)
stock_scaler.columns = columns
stock_scaler
| open | close | high | low | volume | quote_change | max_increase | |
|---|---|---|---|---|---|---|---|
| 0 | 0.007093 | 0.005806 | 0.006509 | 0.006230 | 0.353556 | 0.436961 | 0.299871 |
| 1 | 0.005941 | 0.003638 | 0.005059 | 0.003934 | 0.180317 | 0.378208 | 0.251182 |
| 2 | 0.003274 | 0.003192 | 0.003179 | 0.003006 | 0.066909 | 0.298776 | 0.138405 |
| 3 | 0.003579 | 0.004347 | 0.004181 | 0.003858 | 0.096067 | 0.453358 | 0.151309 |
| 4 | 0.002963 | 0.001504 | 0.002118 | 0.001230 | 0.277342 | 0.403985 | 0.125247 |
| ... | ... | ... | ... | ... | ... | ... | ... |
| 2421 | 0.975205 | 0.978697 | 0.971139 | 0.973477 | 0.059637 | 0.472133 | 0.174081 |
| 2422 | 0.975222 | 0.955397 | 0.964798 | 0.953095 | 0.077333 | 0.437024 | 0.174131 |
| 2423 | 0.962380 | 0.993377 | 0.986338 | 0.960991 | 0.129910 | 0.389368 | 0.120786 |
| 2424 | 1.000000 | 1.000000 | 1.000000 | 1.000000 | 0.069080 | 0.578117 | 0.231230 |
| 2425 | 0.998290 | 0.998549 | 0.995111 | 0.989218 | 0.041473 | 0.430770 | 0.207065 |
2426 rows × 7 columns
# 为了归一化后复现原来数据
close_min = stock_data['quote_change'].min()
close_max = stock_data['quote_change'].max()
# 归一化处理(0,1)
stock=stock_data.apply(lambda x:(x-min(x))/(max(x)-min(x)))
stock
| open | close | high | low | volume | quote_change | max_increase | |
|---|---|---|---|---|---|---|---|
| date | |||||||
| 2010-04-26 | 0.007093 | 0.005806 | 0.006509 | 0.006230 | 0.353556 | 0.436961 | 0.299871 |
| 2010-04-27 | 0.005941 | 0.003638 | 0.005059 | 0.003934 | 0.180317 | 0.378208 | 0.251182 |
| 2010-04-28 | 0.003274 | 0.003192 | 0.003179 | 0.003006 | 0.066909 | 0.298776 | 0.138405 |
| 2010-04-29 | 0.003579 | 0.004347 | 0.004181 | 0.003858 | 0.096067 | 0.453358 | 0.151309 |
| 2010-04-30 | 0.002963 | 0.001504 | 0.002118 | 0.001230 | 0.277342 | 0.403985 | 0.125247 |
| ... | ... | ... | ... | ... | ... | ... | ... |
| 2020-04-20 | 0.975205 | 0.978697 | 0.971139 | 0.973477 | 0.059637 | 0.472133 | 0.174081 |
| 2020-04-21 | 0.975222 | 0.955397 | 0.964798 | 0.953095 | 0.077333 | 0.437024 | 0.174131 |
| 2020-04-22 | 0.962380 | 0.993377 | 0.986338 | 0.960991 | 0.129910 | 0.389368 | 0.120786 |
| 2020-04-23 | 1.000000 | 1.000000 | 1.000000 | 1.000000 | 0.069080 | 0.578117 | 0.23123 |
| 2020-04-24 | 0.998290 | 0.998549 | 0.995111 | 0.989218 | 0.041473 | 0.43077 | 0.207065 |
2426 rows × 7 columns
5 前20天的数据预测之后的数据
stock = stock_scaler
pd.DataFrame(stock.iloc[201:400,].values)
| 0 | 1 | 2 | 3 | 4 | 5 | 6 | |
|---|---|---|---|---|---|---|---|
| 0 | 0.029674 | 0.029436 | 0.029161 | 0.029494 | 0.055448 | 0.424231 | 0.000000 |
| 1 | 0.029393 | 0.028650 | 0.028655 | 0.028507 | 0.087525 | 0.425903 | 0.000000 |
| 2 | 0.028881 | 0.027435 | 0.028486 | 0.027811 | 0.107546 | 0.416771 | 0.000000 |
| 3 | 0.027631 | 0.027946 | 0.027448 | 0.027674 | 0.091984 | 0.387424 | 0.000000 |
| 4 | 0.028094 | 0.028743 | 0.027856 | 0.028413 | 0.092701 | 0.455529 | 0.013949 |
| ... | ... | ... | ... | ... | ... | ... | ... |
| 194 | 0.051861 | 0.051945 | 0.051049 | 0.052022 | 0.028754 | 0.380821 | 0.000000 |
| 195 | 0.051450 | 0.052410 | 0.052271 | 0.051808 | 0.038700 | 0.423796 | 0.000000 |
| 196 | 0.051830 | 0.050992 | 0.051593 | 0.051102 | 0.026645 | 0.449180 | 0.009179 |
| 197 | 0.052522 | 0.054592 | 0.053468 | 0.052875 | 0.082392 | 0.459155 | 0.025905 |
| 198 | 0.054341 | 0.054115 | 0.053112 | 0.053678 | 0.063958 | 0.495008 | 0.069899 |
199 rows × 7 columns
stock
| open | close | high | low | volume | quote_change | max_increase | |
|---|---|---|---|---|---|---|---|
| 0 | 0.007093 | 0.005806 | 0.006509 | 0.006230 | 0.353556 | 0.436961 | 0.299871 |
| 1 | 0.005941 | 0.003638 | 0.005059 | 0.003934 | 0.180317 | 0.378208 | 0.251182 |
| 2 | 0.003274 | 0.003192 | 0.003179 | 0.003006 | 0.066909 | 0.298776 | 0.138405 |
| 3 | 0.003579 | 0.004347 | 0.004181 | 0.003858 | 0.096067 | 0.453358 | 0.151309 |
| 4 | 0.002963 | 0.001504 | 0.002118 | 0.001230 | 0.277342 | 0.403985 | 0.125247 |
| ... | ... | ... | ... | ... | ... | ... | ... |
| 2421 | 0.975205 | 0.978697 | 0.971139 | 0.973477 | 0.059637 | 0.472133 | 0.174081 |
| 2422 | 0.975222 | 0.955397 | 0.964798 | 0.953095 | 0.077333 | 0.437024 | 0.174131 |
| 2423 | 0.962380 | 0.993377 | 0.986338 | 0.960991 | 0.129910 | 0.389368 | 0.120786 |
| 2424 | 1.000000 | 1.000000 | 1.000000 | 1.000000 | 0.069080 | 0.578117 | 0.231230 |
| 2425 | 0.998290 | 0.998549 | 0.995111 | 0.989218 | 0.041473 | 0.430770 | 0.207065 |
2426 rows × 7 columns
# 序列长度为30,即用前一个月的数据预测之后一天的数据
sequence = 20

X = []
y = []
label = []

for i in range(stock.shape[0]-sequence):
    # 选择use_cols作为特征
    X.append(np.array(stock.iloc[i:(i+sequence),].values, dtype=np.float))
    # 选择20天收盘价涨幅
    y.append(np.array(stock.iloc[(i+sequence),5],dtype=np.float))
len(X) , len(X[1])
(2406, 20)
len(y)
2406
划分数据集
from sklearn.model_selection import train_test_split
X_train, X_test, y_train, y_test = train_test_split(X,y, test_size=0.2,random_state=42)
len(X_train)
1924
len(X_test)
482
import torch
import torch.utils.data as Data
torch.manual_seed(1)
# list -> numpy
X_train = np.array(X_train)
y_train = np.array(y_train)
X_test = np.array(X_test)
y_test = np.array(y_test)

# numpy -> torch
X_train = torch.from_numpy(X_train)
y_train = torch.from_numpy(y_train)
X_test = torch.from_numpy(X_test)
y_test = torch.from_numpy(y_test)

print('X_train size: ', X_train.size())
print('y_train size: ', y_train.size())
print('X_test size: ', X_test.size())
print('y_test size: ', y_test.size())
X_train size:  torch.Size([1924, 20, 7])
y_train size:  torch.Size([1924])
X_test size:  torch.Size([482, 20, 7])
y_test size:  torch.Size([482])
6 定义网络模型
#  批处理 batch的大小为32
train_data = Data.TensorDataset(X_train, y_train)
test_data = Data.TensorDataset(X_test, y_test)

train_loader = Data.DataLoader(
    dataset=train_data,
    batch_size=32,
    shuffle=True,
    num_workers=2
)

test_loader = Data.DataLoader(
    dataset=test_data,
    batch_size=32,
    shuffle=True,
    num_workers=2
)
input_size = 7
seq_len = 20
hidden_size = 32
output_size = 1
import torch.nn as nn
import torch.nn.functional as F
from torch.autograd import Variable
class MyNet(nn.Module):
    def __init__(self, input_size=input_size, hidden_size=hidden_size, output_size=output_size):
        super(MyNet, self).__init__()
        self.input_size = input_size
        self.hidden_size = hidden_size
        self.output_size = output_size
        self.lstm = nn.LSTM(input_size=input_size, hidden_size=hidden_size, batch_first=True)
        self.fc = nn.Linear(self.hidden_size*seq_len, self.output_size)
    def forward(self, input):
        out,_ = self.lstm(input)
        b, s, h = out.size()
        out = self.fc(out.reshape(b, s*h))
        return out

net = MyNet()
print(net)
MyNet(
  (lstm): LSTM(7, 32, batch_first=True)
  (fc): Linear(in_features=640, out_features=1, bias=True)
)
7 选择损失函数和优化器
import torch.optim as optim
from tqdm import tqdm

loss_function = nn.MSELoss()
optimizer = optim.Adam(net.parameters(), lr=0.01)

for epoch in tqdm(range(100)):
    total_loss = 0
    for _,(data, label) in enumerate(train_loader):
        data = Variable(data).float()
        pred = net(data)
        label = Variable(label).float()
        label = label.unsqueeze(1)
        loss = loss_function(pred, label)
        loss.backward()
        optimizer.step()
        optimizer.zero_grad()
        total_loss += loss.item()

    if (epoch + 1) % 10 == 0:
        print('Epoch: ', epoch+1, ' loss: ', total_loss)
 10%|████████                                                                         | 10/100 [00:15<02:20,  1.56s/it]

Epoch:  10  loss:  0.39631053362973034


 20%|████████████████▏                                                                | 20/100 [00:30<01:59,  1.49s/it]

Epoch:  20  loss:  0.38432611781172454


 30%|████████████████████████▎                                                        | 30/100 [00:46<01:48,  1.56s/it]

Epoch:  30  loss:  0.3594463015906513


 40%|████████████████████████████████▍                                                | 40/100 [01:02<01:37,  1.62s/it]

Epoch:  40  loss:  0.2304799237754196


 50%|████████████████████████████████████████▌                                        | 50/100 [01:17<01:17,  1.55s/it]

Epoch:  50  loss:  0.19538419507443905


 60%|████████████████████████████████████████████████▌                                | 60/100 [01:33<01:06,  1.66s/it]

Epoch:  60  loss:  0.15910959872417152


 70%|████████████████████████████████████████████████████████▋                        | 70/100 [01:50<00:51,  1.73s/it]

Epoch:  70  loss:  0.10108215303625911


 80%|████████████████████████████████████████████████████████████████▊                | 80/100 [02:07<00:32,  1.63s/it]

Epoch:  80  loss:  0.09773806459270418


 90%|████████████████████████████████████████████████████████████████████████▉        | 90/100 [02:23<00:16,  1.67s/it]

Epoch:  90  loss:  0.06839053201838396


100%|████████████████████████████████████████████████████████████████████████████████| 100/100 [02:41<00:00,  1.62s/it]

Epoch:  100  loss:  0.06617061665747315
8 测试
pred_list = []
label_list = []

for _, (data, label) in enumerate(test_loader):
    data = Variable(data).float()
    pred = net(data)
    pred_list.extend(pred.data.squeeze(1).tolist())
    label_list.extend(label.tolist())
pred_list[:5]
[0.4532894492149353,
 0.4373990297317505,
 0.4552455246448517,
 0.3734513521194458,
 0.4417729675769806]
len(pred_list)
482
label_list[:5]
[0.4526440093601085,
 0.4235539693300972,
 0.4670736837074137,
 0.3081553795002458,
 0.5096712136068774]
9 可视化
import matplotlib.pyplot as plt
plt.rcParams['font.sans-serif'] = [u'SimHei']
plt.rcParams['axes.unicode_minus'] = False
import matplotlib.pyplot as plt

plt.figure(figsize=(20,6))

plt.plot([i*(close_max-close_min)+close_min for i in pred_list[:50]] , label='pred')
plt.plot([i*(close_max-close_min)+close_min for i in label_list[:50]], label='real')
plt.title('Stock Forecast(前50条数据)')
plt.legend()
plt.show()
import matplotlib.pyplot as plt
plt.figure(figsize=(20,6))
plt.plot([i*(close_max-close_min)+close_min for i in pred_list[50:100]] , label='pred')
plt.plot([i*(close_max-close_min)+close_min for i in label_list[50:100]], label='real')
plt.title('Stock Forecast')
plt.legend()
plt.show()
import matplotlib.pyplot as plt

plt.figure(figsize=(20,6))
plt.plot(pred_list[400:480] , label='pred')
plt.plot(label_list[400:480], label='real')
plt.title('Stock Forecast(第400条到第480条数据)')
plt.legend()
plt.savefig('dataset/some.jpg')
plt.show()
import matplotlib.pyplot as plt
plt.figure(figsize=(20,6))
plt.plot(pred_list , label='pred')
plt.plot(label_list, label='real')
plt.title('Stock Forecast(测试集所有数据)')
plt.legend()
plt.savefig('dataset/pred_real.jpg')
plt.show()
import matplotlib.pyplot as plt
plt.figure(figsize=(20,6))
plt.plot([i*(close_max-close_min)+close_min for i in pred_list[:482]] , label='pred')
plt.plot([i*(close_max-close_min)+close_min for i in label_list[:482]], label='real')
plt.title('Stock Forecast(测试集所有数据(还原数据))')
plt.legend()
plt.savefig('dataset/all.jpg')
plt.show()
10 保存图片
import matplotlib.pyplot as plt
plt.figure(figsize=(20,6))
plt.plot([i*(close_max-close_min)+close_min for i in pred_list[:482]] , label='pred')
plt.title('Stock Forecast pred')
plt.legend()
plt.savefig('dataset/pred.jpg')
plt.show()
import matplotlib.pyplot as plt
plt.figure(figsize=(20,6))
plt.plot([i*(close_max-close_min)+close_min for i in label_list[:482]], label='real')
plt.title('Stock Forecast (real)')
plt.legend()
plt.savefig('dataset/real.jpg')
plt.show()
11 计算相似度
len(label_list)
482
欧式距离
sum_all = 0
for i in range(len(label_list)):
    sum_all = sum_all + (label_list[i] - pred_list[i])**2
sum_all
1.1392427957537818
DTW
pred_some = pred_list[50:100]
label_some = label_list[50:100]
pred_some = pred_list[:482]
label_some = label_list[0:482]
欧式距离矩阵
distances = np.zeros((len(pred_some), len(pred_some)))
for i in range(len(pred_some)):
    for j in range(len(label_some)):
        distances[i,j] = (label_some[j]-pred_some[i])**2
len(distances)
482
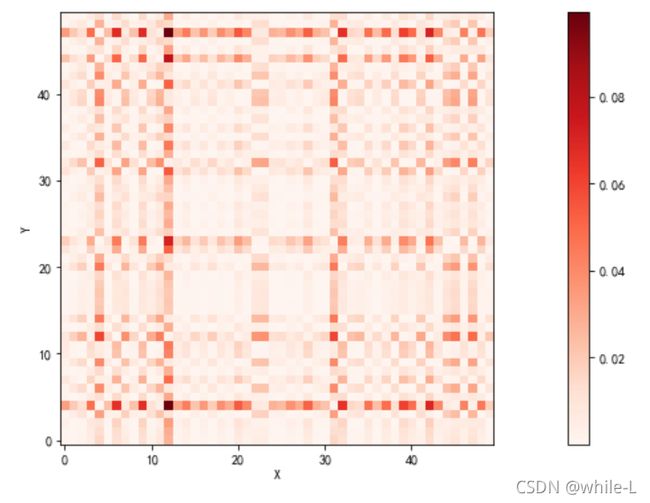
计算两个序列的距离矩阵。横着表示x序列,竖着是y序列。
比如说第0行第0个元素1表示x序列的第0个值和y序列的第0个值的距离(Python的索引从0开始)
颜色越深表示距离越远
欧式距离矩阵可视化
def distance_cost_plot(distances):
    plt.figure(figsize=(20,6))
    plt.imshow(distances, interpolation='nearest', cmap='Reds')
    plt.gca().invert_yaxis()#倒转y轴,让它与x轴的都从左下角开始
    plt.xlabel("X")
    plt.ylabel("Y")
#    plt.grid()
    plt.colorbar()
distance_cost_plot(distances)
x = pred_some
y = label_some
# 计算一个累积距离矩阵
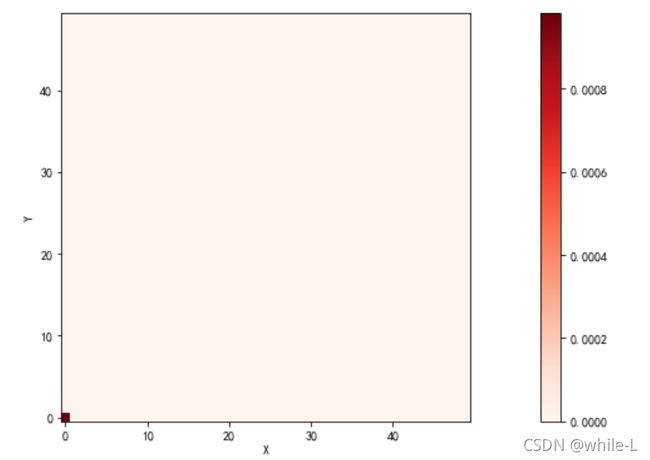
accumulated_cost = np.zeros((len(pred_some), len(label_some)))
accumulated_cost[0,0] = distances[0,0]
pd.DataFrame(accumulated_cost)
| 0 | 1 | 2 | 3 | 4 | 5 | 6 | 7 | 8 | 9 | ... | 472 | 473 | 474 | 475 | 476 | 477 | 478 | 479 | 480 | 481 | |
|---|---|---|---|---|---|---|---|---|---|---|---|---|---|---|---|---|---|---|---|---|---|
| 0 | 4.165926e-07 | 0.0 | 0.0 | 0.0 | 0.0 | 0.0 | 0.0 | 0.0 | 0.0 | 0.0 | ... | 0.0 | 0.0 | 0.0 | 0.0 | 0.0 | 0.0 | 0.0 | 0.0 | 0.0 | 0.0 |
| 1 | 0.000000e+00 | 0.0 | 0.0 | 0.0 | 0.0 | 0.0 | 0.0 | 0.0 | 0.0 | 0.0 | ... | 0.0 | 0.0 | 0.0 | 0.0 | 0.0 | 0.0 | 0.0 | 0.0 | 0.0 | 0.0 |
| 2 | 0.000000e+00 | 0.0 | 0.0 | 0.0 | 0.0 | 0.0 | 0.0 | 0.0 | 0.0 | 0.0 | ... | 0.0 | 0.0 | 0.0 | 0.0 | 0.0 | 0.0 | 0.0 | 0.0 | 0.0 | 0.0 |
| 3 | 0.000000e+00 | 0.0 | 0.0 | 0.0 | 0.0 | 0.0 | 0.0 | 0.0 | 0.0 | 0.0 | ... | 0.0 | 0.0 | 0.0 | 0.0 | 0.0 | 0.0 | 0.0 | 0.0 | 0.0 | 0.0 |
| 4 | 0.000000e+00 | 0.0 | 0.0 | 0.0 | 0.0 | 0.0 | 0.0 | 0.0 | 0.0 | 0.0 | ... | 0.0 | 0.0 | 0.0 | 0.0 | 0.0 | 0.0 | 0.0 | 0.0 | 0.0 | 0.0 |
| ... | ... | ... | ... | ... | ... | ... | ... | ... | ... | ... | ... | ... | ... | ... | ... | ... | ... | ... | ... | ... | ... |
| 477 | 0.000000e+00 | 0.0 | 0.0 | 0.0 | 0.0 | 0.0 | 0.0 | 0.0 | 0.0 | 0.0 | ... | 0.0 | 0.0 | 0.0 | 0.0 | 0.0 | 0.0 | 0.0 | 0.0 | 0.0 | 0.0 |
| 478 | 0.000000e+00 | 0.0 | 0.0 | 0.0 | 0.0 | 0.0 | 0.0 | 0.0 | 0.0 | 0.0 | ... | 0.0 | 0.0 | 0.0 | 0.0 | 0.0 | 0.0 | 0.0 | 0.0 | 0.0 | 0.0 |
| 479 | 0.000000e+00 | 0.0 | 0.0 | 0.0 | 0.0 | 0.0 | 0.0 | 0.0 | 0.0 | 0.0 | ... | 0.0 | 0.0 | 0.0 | 0.0 | 0.0 | 0.0 | 0.0 | 0.0 | 0.0 | 0.0 |
| 480 | 0.000000e+00 | 0.0 | 0.0 | 0.0 | 0.0 | 0.0 | 0.0 | 0.0 | 0.0 | 0.0 | ... | 0.0 | 0.0 | 0.0 | 0.0 | 0.0 | 0.0 | 0.0 | 0.0 | 0.0 | 0.0 |
| 481 | 0.000000e+00 | 0.0 | 0.0 | 0.0 | 0.0 | 0.0 | 0.0 | 0.0 | 0.0 | 0.0 | ... | 0.0 | 0.0 | 0.0 | 0.0 | 0.0 | 0.0 | 0.0 | 0.0 | 0.0 | 0.0 |
482 rows × 482 columns
distance_cost_plot(accumulated_cost)
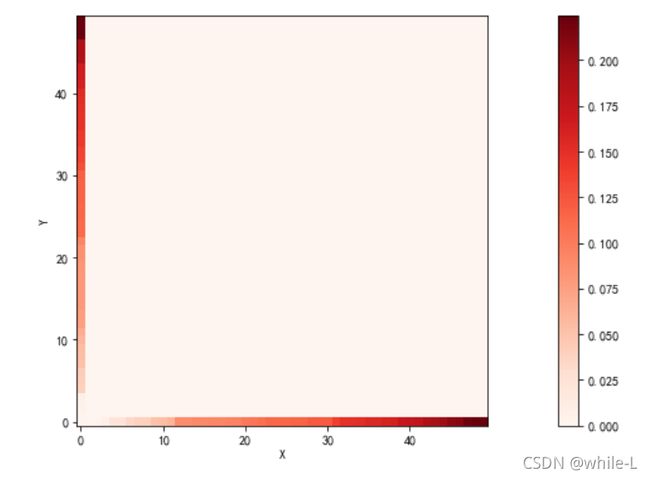
显然累积距离矩阵的第0行第0列=距离矩阵的第0行第0列=1,我们必须经过起点吧……如果我们一直往右走,那么累积距离距离矩阵
# 累积距离距离矩阵
for i in range(1, len(label_some)):
    accumulated_cost[0,i] = distances[0,i] + accumulated_cost[0, i-1]
pd.DataFrame(accumulated_cost)
| 0 | 1 | 2 | 3 | 4 | 5 | 6 | 7 | 8 | 9 | ... | 472 | 473 | 474 | 475 | 476 | 477 | 478 | 479 | 480 | 481 | |
|---|---|---|---|---|---|---|---|---|---|---|---|---|---|---|---|---|---|---|---|---|---|
| 0 | 4.165926e-07 | 0.000885 | 0.001075 | 0.022139 | 0.025317 | 0.028503 | 0.028894 | 0.029663 | 0.030173 | 0.030348 | ... | 2.791318 | 2.794677 | 2.794919 | 2.798835 | 2.803386 | 2.812828 | 2.827525 | 2.828109 | 2.850578 | 2.850708 |
| 1 | 0.000000e+00 | 0.000000 | 0.000000 | 0.000000 | 0.000000 | 0.000000 | 0.000000 | 0.000000 | 0.000000 | 0.000000 | ... | 0.000000 | 0.000000 | 0.000000 | 0.000000 | 0.000000 | 0.000000 | 0.000000 | 0.000000 | 0.000000 | 0.000000 |
| 2 | 0.000000e+00 | 0.000000 | 0.000000 | 0.000000 | 0.000000 | 0.000000 | 0.000000 | 0.000000 | 0.000000 | 0.000000 | ... | 0.000000 | 0.000000 | 0.000000 | 0.000000 | 0.000000 | 0.000000 | 0.000000 | 0.000000 | 0.000000 | 0.000000 |
| 3 | 0.000000e+00 | 0.000000 | 0.000000 | 0.000000 | 0.000000 | 0.000000 | 0.000000 | 0.000000 | 0.000000 | 0.000000 | ... | 0.000000 | 0.000000 | 0.000000 | 0.000000 | 0.000000 | 0.000000 | 0.000000 | 0.000000 | 0.000000 | 0.000000 |
| 4 | 0.000000e+00 | 0.000000 | 0.000000 | 0.000000 | 0.000000 | 0.000000 | 0.000000 | 0.000000 | 0.000000 | 0.000000 | ... | 0.000000 | 0.000000 | 0.000000 | 0.000000 | 0.000000 | 0.000000 | 0.000000 | 0.000000 | 0.000000 | 0.000000 |
| ... | ... | ... | ... | ... | ... | ... | ... | ... | ... | ... | ... | ... | ... | ... | ... | ... | ... | ... | ... | ... | ... |
| 477 | 0.000000e+00 | 0.000000 | 0.000000 | 0.000000 | 0.000000 | 0.000000 | 0.000000 | 0.000000 | 0.000000 | 0.000000 | ... | 0.000000 | 0.000000 | 0.000000 | 0.000000 | 0.000000 | 0.000000 | 0.000000 | 0.000000 | 0.000000 | 0.000000 |
| 478 | 0.000000e+00 | 0.000000 | 0.000000 | 0.000000 | 0.000000 | 0.000000 | 0.000000 | 0.000000 | 0.000000 | 0.000000 | ... | 0.000000 | 0.000000 | 0.000000 | 0.000000 | 0.000000 | 0.000000 | 0.000000 | 0.000000 | 0.000000 | 0.000000 |
| 479 | 0.000000e+00 | 0.000000 | 0.000000 | 0.000000 | 0.000000 | 0.000000 | 0.000000 | 0.000000 | 0.000000 | 0.000000 | ... | 0.000000 | 0.000000 | 0.000000 | 0.000000 | 0.000000 | 0.000000 | 0.000000 | 0.000000 | 0.000000 | 0.000000 |
| 480 | 0.000000e+00 | 0.000000 | 0.000000 | 0.000000 | 0.000000 | 0.000000 | 0.000000 | 0.000000 | 0.000000 | 0.000000 | ... | 0.000000 | 0.000000 | 0.000000 | 0.000000 | 0.000000 | 0.000000 | 0.000000 | 0.000000 | 0.000000 | 0.000000 |
| 481 | 0.000000e+00 | 0.000000 | 0.000000 | 0.000000 | 0.000000 | 0.000000 | 0.000000 | 0.000000 | 0.000000 | 0.000000 | ... | 0.000000 | 0.000000 | 0.000000 | 0.000000 | 0.000000 | 0.000000 | 0.000000 | 0.000000 | 0.000000 | 0.000000 |
482 rows × 482 columns
distance_cost_plot(accumulated_cost)
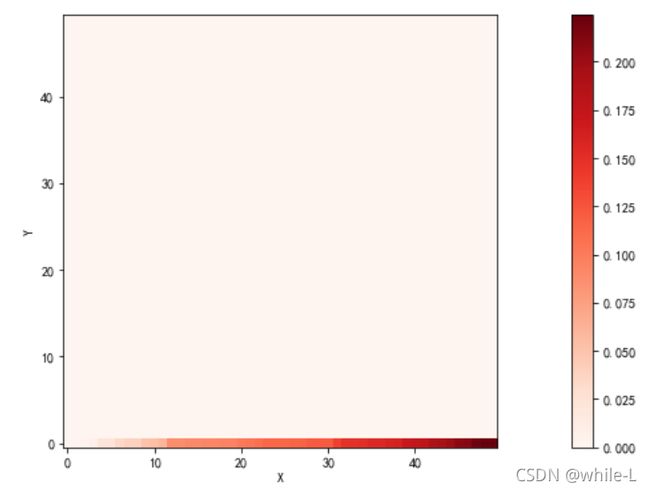
如果我们一直往上走,那么
for i in range(1, len(pred_some)):
    accumulated_cost[i,0] = distances[i, 0] + accumulated_cost[i-1, 0]
pd.DataFrame(accumulated_cost)
| 0 | 1 | 2 | 3 | 4 | 5 | 6 | 7 | 8 | 9 | ... | 472 | 473 | 474 | 475 | 476 | 477 | 478 | 479 | 480 | 481 | |
|---|---|---|---|---|---|---|---|---|---|---|---|---|---|---|---|---|---|---|---|---|---|
| 0 | 4.165926e-07 | 0.000885 | 0.001075 | 0.022139 | 0.025317 | 0.028503 | 0.028894 | 0.029663 | 0.030173 | 0.030348 | ... | 2.791318 | 2.794677 | 2.794919 | 2.798835 | 2.803386 | 2.812828 | 2.827525 | 2.828109 | 2.850578 | 2.850708 |
| 1 | 2.328260e-04 | 0.000000 | 0.000000 | 0.000000 | 0.000000 | 0.000000 | 0.000000 | 0.000000 | 0.000000 | 0.000000 | ... | 0.000000 | 0.000000 | 0.000000 | 0.000000 | 0.000000 | 0.000000 | 0.000000 | 0.000000 | 0.000000 | 0.000000 |
| 2 | 2.395939e-04 | 0.000000 | 0.000000 | 0.000000 | 0.000000 | 0.000000 | 0.000000 | 0.000000 | 0.000000 | 0.000000 | ... | 0.000000 | 0.000000 | 0.000000 | 0.000000 | 0.000000 | 0.000000 | 0.000000 | 0.000000 | 0.000000 | 0.000000 |
| 3 | 6.511071e-03 | 0.000000 | 0.000000 | 0.000000 | 0.000000 | 0.000000 | 0.000000 | 0.000000 | 0.000000 | 0.000000 | ... | 0.000000 | 0.000000 | 0.000000 | 0.000000 | 0.000000 | 0.000000 | 0.000000 | 0.000000 | 0.000000 | 0.000000 |
| 4 | 6.629250e-03 | 0.000000 | 0.000000 | 0.000000 | 0.000000 | 0.000000 | 0.000000 | 0.000000 | 0.000000 | 0.000000 | ... | 0.000000 | 0.000000 | 0.000000 | 0.000000 | 0.000000 | 0.000000 | 0.000000 | 0.000000 | 0.000000 | 0.000000 |
| ... | ... | ... | ... | ... | ... | ... | ... | ... | ... | ... | ... | ... | ... | ... | ... | ... | ... | ... | ... | ... | ... |
| 477 | 2.676938e+00 | 0.000000 | 0.000000 | 0.000000 | 0.000000 | 0.000000 | 0.000000 | 0.000000 | 0.000000 | 0.000000 | ... | 0.000000 | 0.000000 | 0.000000 | 0.000000 | 0.000000 | 0.000000 | 0.000000 | 0.000000 | 0.000000 | 0.000000 |
| 478 | 2.696313e+00 | 0.000000 | 0.000000 | 0.000000 | 0.000000 | 0.000000 | 0.000000 | 0.000000 | 0.000000 | 0.000000 | ... | 0.000000 | 0.000000 | 0.000000 | 0.000000 | 0.000000 | 0.000000 | 0.000000 | 0.000000 | 0.000000 | 0.000000 |
| 479 | 2.696541e+00 | 0.000000 | 0.000000 | 0.000000 | 0.000000 | 0.000000 | 0.000000 | 0.000000 | 0.000000 | 0.000000 | ... | 0.000000 | 0.000000 | 0.000000 | 0.000000 | 0.000000 | 0.000000 | 0.000000 | 0.000000 | 0.000000 | 0.000000 |
| 480 | 2.709715e+00 | 0.000000 | 0.000000 | 0.000000 | 0.000000 | 0.000000 | 0.000000 | 0.000000 | 0.000000 | 0.000000 | ... | 0.000000 | 0.000000 | 0.000000 | 0.000000 | 0.000000 | 0.000000 | 0.000000 | 0.000000 | 0.000000 | 0.000000 |
| 481 | 2.709716e+00 | 0.000000 | 0.000000 | 0.000000 | 0.000000 | 0.000000 | 0.000000 | 0.000000 | 0.000000 | 0.000000 | ... | 0.000000 | 0.000000 | 0.000000 | 0.000000 | 0.000000 | 0.000000 | 0.000000 | 0.000000 | 0.000000 | 0.000000 |
482 rows × 482 columns
distance_cost_plot(accumulated_cost)
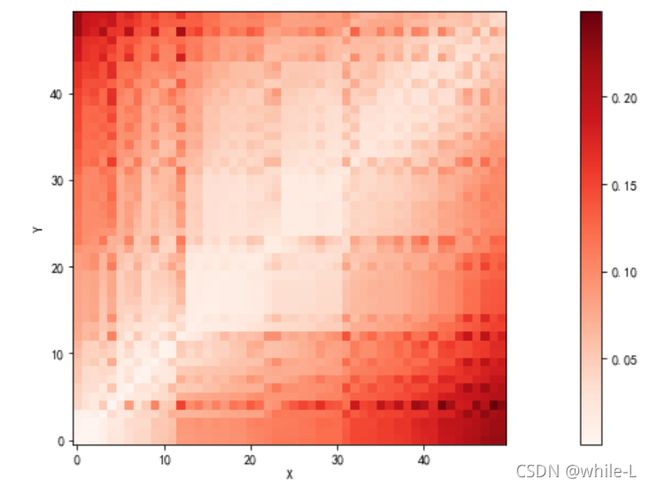
把累积距离矩阵计算完整
for i in range(1, len(pred_some)):
    for j in range(1, len(label_some)):
        accumulated_cost[i, j] = min(accumulated_cost[i-1, j-1], accumulated_cost[i-1, j], accumulated_cost[i, j-1]) + distances[i, j]
pd.DataFrame(accumulated_cost)
| 0 | 1 | 2 | 3 | 4 | 5 | 6 | 7 | 8 | 9 | ... | 472 | 473 | 474 | 475 | 476 | 477 | 478 | 479 | 480 | 481 | |
|---|---|---|---|---|---|---|---|---|---|---|---|---|---|---|---|---|---|---|---|---|---|
| 0 | 4.165926e-07 | 0.000885 | 0.001075 | 0.022139 | 0.025317 | 0.028503 | 0.028894 | 0.029663 | 0.030173 | 0.030348 | ... | 2.791318 | 2.794677 | 2.794919 | 2.798835 | 2.803386 | 2.812828 | 2.827525 | 2.828109 | 2.850578 | 2.850708 |
| 1 | 2.328260e-04 | 0.000192 | 0.001073 | 0.017777 | 0.023000 | 0.024644 | 0.025915 | 0.026055 | 0.027535 | 0.027542 | ... | 2.784774 | 2.790229 | 2.790229 | 2.792408 | 2.799356 | 2.805962 | 2.817059 | 2.817128 | 2.844613 | 2.844633 |
| 2 | 2.395939e-04 | 0.001196 | 0.000332 | 0.021968 | 0.020739 | 0.024149 | 0.024466 | 0.025348 | 0.025773 | 0.026003 | ... | 2.757107 | 2.760244 | 2.760550 | 2.764715 | 2.769005 | 2.778831 | 2.794007 | 2.794689 | 2.816575 | 2.816754 |
| 3 | 6.511071e-03 | 0.002750 | 0.009097 | 0.004596 | 0.023151 | 0.021286 | 0.031205 | 0.027180 | 0.035836 | 0.030210 | ... | 2.759153 | 2.776096 | 2.764378 | 2.760848 | 2.782545 | 2.769306 | 2.771019 | 2.774119 | 2.826897 | 2.821256 |
| 4 | 6.629250e-03 | 0.003082 | 0.003390 | 0.021244 | 0.009206 | 0.011224 | 0.012202 | 0.012465 | 0.013627 | 0.013630 | ... | 2.710571 | 2.715399 | 2.715415 | 2.718022 | 2.724259 | 2.731596 | 2.743634 | 2.743794 | 2.769848 | 2.769848 |
| ... | ... | ... | ... | ... | ... | ... | ... | ... | ... | ... | ... | ... | ... | ... | ... | ... | ... | ... | ... | ... | ... |
| 477 | 2.676938e+00 | 2.670701 | 2.651317 | 2.633292 | 2.665250 | 2.625748 | 2.589558 | 2.560992 | 2.560040 | 2.527341 | ... | 0.777889 | 0.798232 | 0.777122 | 0.773360 | 0.805854 | 0.770449 | 0.770450 | 0.780098 | 0.854235 | 0.798668 |
| 478 | 2.696313e+00 | 2.682825 | 2.674917 | 2.633320 | 2.671796 | 2.632704 | 2.615029 | 2.573559 | 2.586418 | 2.543372 | ... | 0.790750 | 0.817015 | 0.792572 | 0.779330 | 0.816334 | 0.772270 | 0.770795 | 0.783832 | 0.864046 | 0.815159 |
| 479 | 2.696541e+00 | 2.683021 | 2.675789 | 2.650064 | 2.638521 | 2.634361 | 2.616289 | 2.573703 | 2.575026 | 2.543378 | ... | 0.790865 | 0.796182 | 0.792572 | 0.781524 | 0.786252 | 0.778901 | 0.781925 | 0.770866 | 0.798300 | 0.798319 |
| 480 | 2.709715e+00 | 2.703718 | 2.685858 | 2.717282 | 2.641856 | 2.663456 | 2.625196 | 2.593830 | 2.582086 | 2.559598 | ... | 0.810622 | 0.794020 | 0.809387 | 0.812749 | 0.783702 | 0.823548 | 0.834297 | 0.789990 | 0.772145 | 0.787908 |
| 481 | 2.709716e+00 | 2.704500 | 2.686100 | 2.706414 | 2.645237 | 2.644846 | 2.625659 | 2.594505 | 2.582678 | 2.559730 | ... | 0.795156 | 0.797587 | 0.794210 | 0.797908 | 0.788494 | 0.792804 | 0.807078 | 0.790492 | 0.795145 | 0.772238 |
482 rows × 482 columns
distance_cost_plot(accumulated_cost)
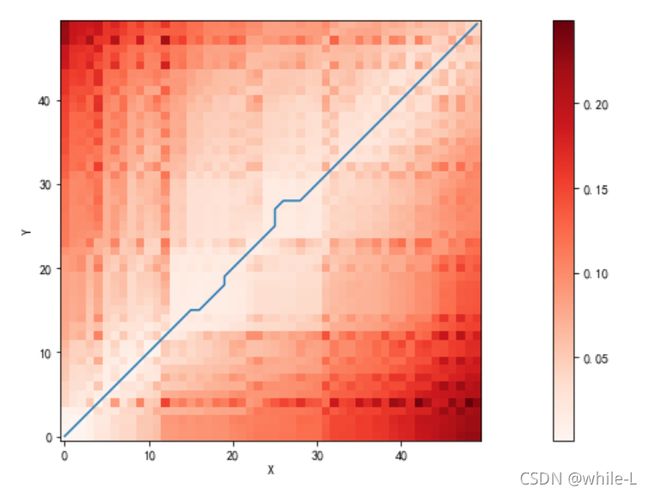
现在,最佳路径已经清晰地显示在了累积距离矩阵之中,就是图中颜色最淡的方块。
现在,我们只需要通过回溯的方法找回最佳路径就可以了:
path = [[len(label_some)-1, len(pred_some)-1]]
i = len(pred_some)-1
j = len(label_some)-1
while i>0 and j>0:
    if i==0:
        j = j - 1
    elif j==0:
        i = i - 1
    else:
        if accumulated_cost[i-1, j] == min(accumulated_cost[i-1, j-1], accumulated_cost[i-1, j], accumulated_cost[i, j-1]):
            i = i - 1#来自于左边
        elif accumulated_cost[i, j-1] == min(accumulated_cost[i-1, j-1], accumulated_cost[i-1, j], accumulated_cost[i, j-1]):
            j = j-1#来自于下边
        else:
            i = i - 1#来自于左下边
            j= j- 1
    path.append([j, i])
path.append([0,0])
path_x = [point[0] for point in path]
path_y = [point[1] for point in path]
distance_cost_plot(accumulated_cost)
plt.plot(path_x, path_y)
[]
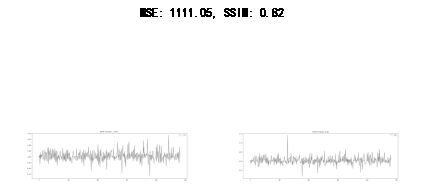
图片相似度
from skimage.metrics import structural_similarity as sk_cpt_ssim
import matplotlib.pyplot as plt
import numpy as np
import cv2

def mse(imageA, imageB):
    # 计算两张图片的MSE指标
    err = np.sum((imageA.astype("float") - imageB.astype("float")) ** 2)
    err /= float(imageA.shape[0] * imageA.shape[1])

    # 返回结果,该值越小越好
    return err

def compare_images(imageA, imageB, title):
    # 分别计算输入图片的MSE和SSIM指标值的大小
    m = mse(imageA, imageB)
    s = sk_cpt_ssim(imageA, imageB)

    # 创建figure
    fig = plt.figure(title)
    plt.suptitle("MSE: %.2f, SSIM: %.2f" % (m, s))

    # 显示第一张图片
    ax = fig.add_subplot(1, 2, 1)
    plt.imshow(imageA, cmap = plt.cm.gray)
    plt.axis("off")

    # 显示第二张图片
    ax = fig.add_subplot(1, 2, 2)
    plt.imshow(imageB, cmap = plt.cm.gray)
    plt.axis("off")
    plt.tight_layout()
    plt.show()


# 读取图片
pred_image = cv2.imread("dataset/pred.jpg")
real_image = cv2.imread("dataset/real.jpg")
all_image = cv2.imread('dataset/all.jpg')
some_image = cv2.imread('dataset/some.jpg')

# 将彩色图转换为灰度图
pred = cv2.cvtColor(pred_image, cv2.COLOR_BGR2GRAY)
real = cv2.cvtColor(real_image, cv2.COLOR_BGR2GRAY)
all_image = cv2.cvtColor(all_image,cv2.COLOR_BGR2GRAY)
some_image = cv2.cvtColor(some_image,cv2.COLOR_BGR2GRAY)

# 初始化figure对象
fig = plt.figure("Images")
# images = ("pred", pred), ("real", real),('all',all_image),('some',some_image)
images = ("pred", pred), ("real", real)

# 遍历每张图片
for (i, (name, image)) in enumerate(images):
    # 显示图片
    ax = fig.add_subplot(1, 4, i + 1)
    ax.set_title(name)
    plt.imshow(image, cmap = plt.cm.gray)
    plt.axis("off")
plt.tight_layout()
plt.show()

# 比较图片
# compare_images(real, real, "real vs real")
compare_images(real, pred, "real vs pred")
# compare_images(all_image, pred, "real vs pred")
# compare_images(some_image,all_image,'some vs all')
