主成分分析(PCA)及其可视化的基础指南
主成分分析(PCA)及其可视化的基础指南
后台很多同学私信想学习一下主成分分析(PCA),今天就简单写一下。之后有看到文章再实战复现。
主成分分析(PCA)是一种将数据降维技巧,它将大量相关变量转化成一组很少的不相关变量,这些无相关变量称为主成分。
本文代码领取:后台回复“20210507”
下面以R语言自带的iris范例数据集为例,探索一下主成分分析的具体过程。
#导入iris数据集
data<-irisr
head(data)
> head(data)
  Sepal.Length Sepal.Width Petal.Length Petal.Width Species
1          5.1         3.5          1.4         0.2  setosa
2          4.9         3.0          1.4         0.2  setosa
3          4.7         3.2          1.3         0.2  setosa
4          4.6         3.1          1.5         0.2  setosa
5          5.0         3.6          1.4         0.2  setosa
6          5.4         3.9          1.7         0.4  setosa
1. 数据标准化
如果不对数据进行
scale处理,本身数值大的基因对主成分的贡献会大。如果关注的是变量的相对大小对样品分类的贡献,则应scale,以防数值高的变量导入的大方差引入的偏见。但是定标(scale)可能会有一些负面效果,因为定标后变量之间的权重就是变得相同。如果我们的变量中有噪音的话,我们就在无形中把噪音和信息的权重变得相同,但PCA本身无法区分信号和噪音。在这样的情形下,我们就不必做定标。
#对原数据进行z-score归一化;
dt<-as.matrix(scale(data[,1:4])) #不含Species列
head(dt)
> head(dt)
     Sepal.Length Sepal.Width Petal.Length Petal.Width
[1,]       -0.898      1.0156        -1.34       -1.31
[2,]       -1.139     -0.1315        -1.34       -1.31
[3,]       -1.381      0.3273        -1.39       -1.31
[4,]       -1.501      0.0979        -1.28       -1.31
[5,]       -1.018      1.2450        -1.34       -1.31
[6,]       -0.535      1.9333        -1.17       -1.05
2. 计算协方差
#计算协方差
rm1<-cor(dt)
rm1
3. 计算特征值及相应的特征向量
特征值与特征向量均为矩阵分解的结果。特征值表示标量部分,一般为某个主成分的方差,其相对比例可理解为方差解释度或贡献度 ;特征值从第一主成分会逐渐减小。
特征向量为对应主成分的线性转换向量(线性回归系数),特征向量与原始矩阵的矩阵积为主成分得分。特征向量是单位向量,其平方和为1。
#特征分解
rs1<-eigen(rm1)
rs1
> rs1
eigen() decomposition
$values
[1] 2.9185 0.9140 0.1468 0.0207

$vectors
       [,1]    [,2]   [,3]   [,4]
[1,]  0.521 -0.3774  0.720  0.261
[2,] -0.269 -0.9233 -0.244 -0.124
[3,]  0.580 -0.0245 -0.142 -0.801
[4,]  0.565 -0.0669 -0.634  0.524
#提取结果中的特征值,即各主成分的方差;
val <- rs1$values
#转换成标准差Standard deviation
Standard_deviation <- sqrt(val)
Standard_deviation
#计算方差贡献率和累积贡献率;
Proportion_of_Variance <- val/sum(val)
Proportion_of_Variance
Cumulative_Proportion <- cumsum(Proportion_of_Variance)
Cumulative_Proportion
> Standard_deviation[1] 1.708 0.956 0.383 0.144> Proportion_of_Variance[1] 0.72962 0.22851 0.03669 0.00518> Cumulative_Proportion[1] 0.730 0.958 0.995 1.00
4. 绘制碎石图
#碎石图绘制par(mar=c(6,6,2,2))plot(rs1$values,type="b", cex=2, cex.lab=2, cex.axis=2, lty=2, lwd=2, xlab = "PC", ylab="Proportion_of_Variance")

5. 计算主成分得分
#提取结果中的特征向量(也称为Loadings,载荷矩阵);
U<-as.matrix(rs1$vectors)
U
#进行矩阵乘法,获得PC score;
PC <-dt %*% U
colnames(PC) <- c("PC1","PC2","PC3","PC4")
head(PC)
> head(PC)
       PC1    PC2     PC3      PC4
[1,] -2.26 -0.478  0.1273  0.02409
[2,] -2.07  0.672  0.2338  0.10266
[3,] -2.36  0.341 -0.0441  0.02828
[4,] -2.29  0.595 -0.0910 -0.06574
[5,] -2.38 -0.645 -0.0157 -0.03580
[6,] -2.07 -1.484 -0.0269  0.00659
6. 可视化
#合并Species列
df<-data.frame(PC,iris$Species)
head(df)
> head(df)
    PC1    PC2     PC3      PC4 iris.Species
1 -2.26 -0.478  0.1273  0.02409       setosa
2 -2.07  0.672  0.2338  0.10266       setosa
3 -2.36  0.341 -0.0441  0.02828       setosa
4 -2.29  0.595 -0.0910 -0.06574       setosa
5 -2.38 -0.645 -0.0157 -0.03580       setosa
6 -2.07 -1.484 -0.0269  0.00659       setosa
library(ggplot2)
#提取主成分的方差贡献率,生成坐标轴标题
xlab<-paste0("PC1(",round(Proportion_of_Variance[1]*100,2),"%)")
ylab<-paste0("PC2(",round(Proportion_of_Variance[2]*100,2),"%)")
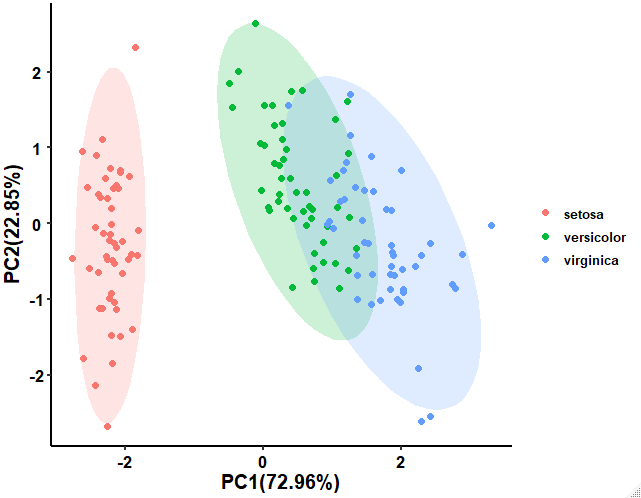
#绘制散点图并添加置信椭圆
p1<-ggplot(data = df,aes(x=PC1,y=PC2,color=iris.Species))+
  stat_ellipse(aes(fill=iris.Species),type ="norm", geom ="polygon",alpha=0.2,color=NA)+
  geom_point(size = 2)+
  labs(x=xlab,y=ylab,color="")+
  guides(fill=F) +
  theme_classic(base_line_size = 1) +
  theme(axis.title.x = element_text(size = 15,
                                    color = "black",
                                    face = "bold"),
          axis.title.y = element_text(size = 15,
                                    # family = "myFont",
                                    color = "black",
                                    face = "bold",
                                    vjust = 1.9,
                                    hjust = 0.5,
                                    angle = 90),
        legend.text = element_text(color="black", # 设置图例标签文字
                                   size = 10,
                                   face = "bold"),
        axis.text.x = element_text(size = 13,  # 修改X轴上字体大小,
                                   color = "black", # 颜色
                                   face = "bold", #  face取值:plain普通,bold加粗,italic斜体,bold.italic斜体加粗
                                   vjust = 0.5, # 位置
                                   hjust = 0.5,
                                   angle = 0), #角度
        axis.text.y = element_text(size = 13,
                                   color = "black",
                                   face = "bold",
                                   vjust = 0.5,
                                   hjust = 0.5,
                                   angle = 0)
  )
p1
#用3个主成分绘制3D图
#载入scatterplot3d包
library(scatterplot3d)
color = c(rep('purple',50),rep('orange',50),rep('blue',50))
scatterplot3d(df[,1:3],
              color=color,
              pch = 16,
              angle=30,
              box=T,
              type="p",
              lty.hide=2,
              lty.grid = 2)
legend(x = -3, y =4.5,
       c('Setosa','Versicolor','Virginica'),
       fill=c('purple','orange','blue'),
       box.col=NA)
注:以上分析可以用R中最常见的两个PCA函数:
prcomp()和princomp()一步到位。具体步骤,之后再写。
写在后面:
大家有问题可以后台私信,或者在我的B站:
木舟笔记进行互动!制作不易,希望大家多多支持!

