自动驾驶入门(十二):基于Opencv的车道线识别
车道线识别有两种方法:
- 基于Opencv的传统视觉车道线识别方案
- 基于深度学习的车道线识别方案
本文将介绍基于Opencv的传统视觉车道线识别方案。
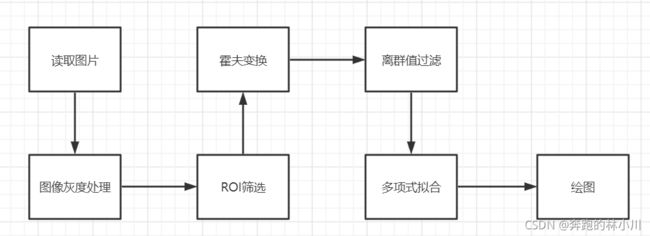
传统的车道线识别解决方案流程图如下:
代码实现如下所示,具体描述 @ 陈光 博主以及 @开水果摊能卖你生瓜蛋已经描述的很清晰了,请直接查看链接
import cv2 as cv
import numpy as np

def region_of_interest(img, vertices):
    mask = np.zeros_like(img)
    if len(img.shape) > 2:
        channel_count = img.shape[2]
        ignore_mask_color = (255,)
    else:
        ignore_mask_color = 255

    cv.fillPoly(mask, [vertices], ignore_mask_color)
    masked_img = cv.bitwise_and(img, mask)
    return masked_img

def calc_slope(line):
    x1, y1, x2, y2 = line[0]
    return (y2-y1)/(x2-x1)

def line_selection(lines, threshold):
    slopes = [calc_slope(line) for line in lines]
    while len(lines) > 0:
        mean = np.mean(slopes)
        diff = [abs(s-mean) for s in slopes]
        idx = np.argmax(diff)
        if diff[idx] > threshold:
            slopes.pop(idx)
            lines.pop(idx)
        else:
            break
    # return lines

def least_squres_fit(lines):
    x_coords = np.ravel([[line[0][0], line[0][2]] for line in lines])
    y_coords = np.ravel([[line[0][1], line[0][3]] for line in lines])
    poly = np.polyfit(x_coords, y_coords, deg=1)
    point_min = (np.min(x_coords), np.polyval(poly, np.min(x_coords)))
    point_max = (np.max(x_coords), np.polyval(poly, np.max(x_coords)))
    return np.array([point_min, point_max], dtype=np.int)


if __name__ == '__main__':

    img_path = r'C:\Users\HP\Pictures\lane.png'

    img = cv.imread(img_path, cv.IMREAD_COLOR)
    gray = cv.cvtColor(img, cv.COLOR_RGB2GRAY)

    low_threshold = 150
    high_threshold = 300

    canny_img = cv.Canny(gray, low_threshold, high_threshold)

    # cut interested img
    left_bottom = [0, canny_img.shape[0]]
    right_bottom = [canny_img.shape[1]-60, canny_img.shape[0]]

    apex = [canny_img.shape[1]/2, 120]
    vertices = np.array([left_bottom, right_bottom, apex], np.int32)
    roi_img = region_of_interest(canny_img, vertices)

    # hough lines operation
    lines = cv.HoughLinesP(roi_img, 1, theta=np.pi/180, threshold=15,  minLineLength=40, maxLineGap=20)

    # classify the line by slope
    left_lines = [line for line in lines if calc_slope(line) > 0]
    right_lines = [line for line in lines if calc_slope(line) < 0]

    # use threshold to modify the lines to select lines.
    print("before operation: {}".format(len(left_lines)))
    line_selection(left_lines, threshold=0.1)
    line_selection(right_lines, threshold=0.1)
    print("after operation: {}".format(len(left_lines)))

    left_line = least_squres_fit(left_lines)
    right_line = least_squres_fit(right_lines)

    cv.line(img, tuple(left_line[0]), tuple(left_line[1]), color=[255, 0, 0], thickness=6)
    cv.line(img, tuple(right_line[0]), tuple(right_line[1]), color=[255, 0, 0], thickness=6)

    cv.imshow('gray', img)
    cv.waitKey(0)
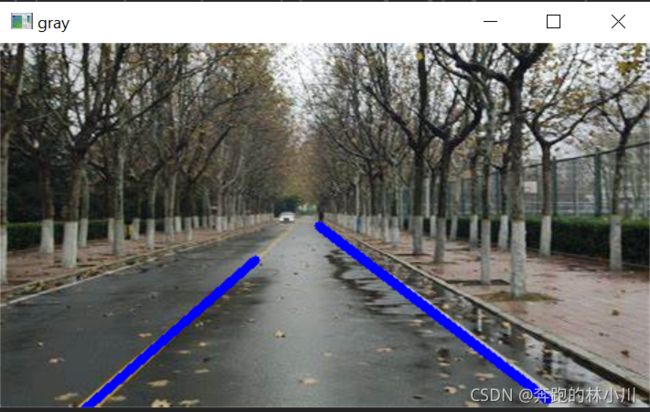
最终展示效果如图:
参考链接:
无人驾驶技术入门(十四)| 初识图像之初级车道线检测 - 知乎
车道线检测 _ 搜索结果_哔哩哔哩_Bilibili
Opencv(四):图像边缘检测_林小川的博客-CSDN博客

