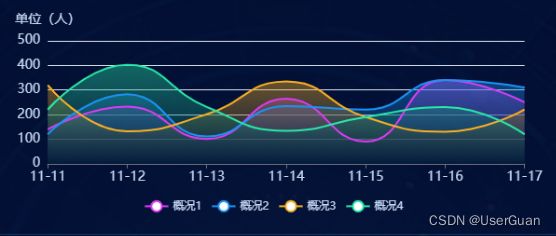
echarts 折线图面积区域渐变
效果图
核心代码
series: [
  {
    name: "概况1",
    type: "line",
    smooth: true, // 平滑显示
    // lineStyle: { width: 0 },
    showSymbol: false, // 隐藏节点
    areaStyle: {
      opacity: 0.4,
      color: new echarts.graphic.LinearGradient(0, 0, 0, 1, [
        { offset: 1, color: "#051d3d" },
        { offset: 0, color: "#de3af5" },
      ]),
    },
    data: [140, 232, 101, 264, 90, 340, 250],
  }
]
完整代码
/* 变化趋势eCharts图 */
initCharts(e) {
  this.$nextTick(() => {
    const myChart = echarts.init(document.getElementById("main")); // 初始化 echarts 实例
    const nameList = ["概况1", "概况2", "概况3", "概况4"]; // 名称列表
    const initColor = "#051d3d"; // 初始颜色
    const initOpacity = 0.4; // 初始透明度
    const colorList = ["#de3af5", "#1a93f6", "#fab021", "#29e8a8"]; // 颜色列表
    e.date = ["11-11", "11-12", "11-13", "11-14", "11-15", "11-16", "11-17"]; // 日期
    e.dispose = [140, 232, 101, 264, 90, 340, 250]; // 概况1
    e.isolate = [120, 282, 111, 234, 220, 340, 310]; // 概况2
    e.focusIsolate = [320, 132, 201, 334, 190, 130, 220]; // 概况3
    e.homeIsolate = [220, 402, 231, 134, 190, 230, 120]; // 概况4
    // 指定图表的配置项和数据
    const option = {
      color: colorList,
      tooltip: {
        trigger: "axis",
        axisPointer: {
          type: "cross",
          label: { backgroundColor: "#6a7985" },
        },
      },
      legend: {
        textStyle: { color: "#c8dbf4" },
        bottom: 0,
        data: nameList,
      },
      grid: {
        top: "14%",
        left: "3%",
        right: "4%",
        bottom: "16%",
        containLabel: true,
      },
      xAxis: {
        type: "category",
        boundaryGap: false,
        axisLabel: { color: "#c8dbf4", fontSize: "14px" },
        data: e.date,
      },
      yAxis: {
        type: "value",
        name: "单位(人)",
        nameTextStyle: { color: "#c8dbf4", fontSize: "14px" },
        axisLabel: { color: "#c8dbf4", fontSize: "14px" },
      },
      series: [
        {
          name: nameList[0],
          type: "line",
          smooth: true, // 平滑显示
          // lineStyle: { width: 0 },
          showSymbol: false, // 隐藏节点
          areaStyle: {
            opacity: initOpacity,
            color: new echarts.graphic.LinearGradient(0, 0, 0, 1, [
              { offset: 1, color: initColor },
              { offset: 0, color: colorList[0] },
            ]),
          },
          data: e.dispose,
        },
        {
          name: nameList[1],
          type: "line",
          smooth: true, // 平滑显示
          // lineStyle: { width: 0 },
          showSymbol: false, // 隐藏节点
          areaStyle: {
            opacity: initOpacity,
            color: new echarts.graphic.LinearGradient(0, 0, 0, 1, [
              { offset: 1, color: initColor },
              { offset: 0, color: colorList[1] },
            ]),
          },
          data: e.isolate,
        },
        {
          name: nameList[2],
          type: "line",
          smooth: true, // 平滑显示
          // lineStyle: { width: 0 },
          showSymbol: false, // 隐藏节点
          areaStyle: {
            opacity: initOpacity,
            color: new echarts.graphic.LinearGradient(0, 0, 0, 1, [
              { offset: 1, color: initColor },
              { offset: 0, color: colorList[2] },
            ]),
          },
          data: e.focusIsolate,
        },
        {
          name: nameList[3],
          type: "line",
          smooth: true, // 平滑显示
          // lineStyle: { width: 0 },
          showSymbol: false, // 隐藏节点
          areaStyle: {
            opacity: initOpacity,
            color: new echarts.graphic.LinearGradient(0, 0, 0, 1, [
              { offset: 1, color: initColor },
              { offset: 0, color: colorList[3] },
            ]),
          },
          data: e.homeIsolate,
        },
      ],
    };
    myChart.setOption(option);
  });
}
官网参考例子:Examples - Apache ECharts
