岭回归与多重共线性
- 1.线性回归
-
- 1.1 导入需要的模块和库
- 1.2 导入数据,探索数据
- 1.3 分训练集和测试集
- 1.4 建模
- 1.5 探索建好的模型
- 2.回归类模型的评估指标
-
- 3. 多重共线性
- 4. 岭回归
-
- 4.1 岭回归解决多重共线性问题及参数Ridge
- 4.2 选取最佳的正则化参数取值
1.线性回归
1.1 导入需要的模块和库
from sklearn.linear_model import LinearRegression as LR
from sklearn.model_selection import train_test_split
from sklearn.model_selection import cross_val_score
from sklearn.datasets import fetch_california_housing as fch
import pandas as pd
1.2 导入数据,探索数据
housevalue = fch()
housevalue.data
array([[   8.3252    ,   41.        ,    6.98412698, ...,    2.55555556,
          37.88      , -122.23      ],
       [   8.3014    ,   21.        ,    6.23813708, ...,    2.10984183,
          37.86      , -122.22      ],
       [   7.2574    ,   52.        ,    8.28813559, ...,    2.80225989,
          37.85      , -122.24      ],
       ...,
       [   1.7       ,   17.        ,    5.20554273, ...,    2.3256351 ,
          39.43      , -121.22      ],
       [   1.8672    ,   18.        ,    5.32951289, ...,    2.12320917,
          39.43      , -121.32      ],
       [   2.3886    ,   16.        ,    5.25471698, ...,    2.61698113,
          39.37      , -121.24      ]])
X = pd.DataFrame(housevalue.data)
X
|
0 |
1 |
2 |
3 |
4 |
5 |
6 |
7 |
| 0 |
8.3252 |
41.0 |
6.984127 |
1.023810 |
322.0 |
2.555556 |
37.88 |
-122.23 |
| 1 |
8.3014 |
21.0 |
6.238137 |
0.971880 |
2401.0 |
2.109842 |
37.86 |
-122.22 |
| 2 |
7.2574 |
52.0 |
8.288136 |
1.073446 |
496.0 |
2.802260 |
37.85 |
-122.24 |
| 3 |
5.6431 |
52.0 |
5.817352 |
1.073059 |
558.0 |
2.547945 |
37.85 |
-122.25 |
| 4 |
3.8462 |
52.0 |
6.281853 |
1.081081 |
565.0 |
2.181467 |
37.85 |
-122.25 |
| ... |
... |
... |
... |
... |
... |
... |
... |
... |
| 20635 |
1.5603 |
25.0 |
5.045455 |
1.133333 |
845.0 |
2.560606 |
39.48 |
-121.09 |
| 20636 |
2.5568 |
18.0 |
6.114035 |
1.315789 |
356.0 |
3.122807 |
39.49 |
-121.21 |
| 20637 |
1.7000 |
17.0 |
5.205543 |
1.120092 |
1007.0 |
2.325635 |
39.43 |
-121.22 |
| 20638 |
1.8672 |
18.0 |
5.329513 |
1.171920 |
741.0 |
2.123209 |
39.43 |
-121.32 |
| 20639 |
2.3886 |
16.0 |
5.254717 |
1.162264 |
1387.0 |
2.616981 |
39.37 |
-121.24 |
20640 rows × 8 columns
X.shape
(20640, 8)
y = housevalue.target
y
array([4.526, 3.585, 3.521, ..., 0.923, 0.847, 0.894])
y.min()
0.14999
y.max()
5.00001
y.shape
(20640,)
X.head()
|
0 |
1 |
2 |
3 |
4 |
5 |
6 |
7 |
| 0 |
8.3252 |
41.0 |
6.984127 |
1.023810 |
322.0 |
2.555556 |
37.88 |
-122.23 |
| 1 |
8.3014 |
21.0 |
6.238137 |
0.971880 |
2401.0 |
2.109842 |
37.86 |
-122.22 |
| 2 |
7.2574 |
52.0 |
8.288136 |
1.073446 |
496.0 |
2.802260 |
37.85 |
-122.24 |
| 3 |
5.6431 |
52.0 |
5.817352 |
1.073059 |
558.0 |
2.547945 |
37.85 |
-122.25 |
| 4 |
3.8462 |
52.0 |
6.281853 |
1.081081 |
565.0 |
2.181467 |
37.85 |
-122.25 |
housevalue.feature_names
['MedInc',
 'HouseAge',
 'AveRooms',
 'AveBedrms',
 'Population',
 'AveOccup',
 'Latitude',
 'Longitude']
X.columns = housevalue.feature_names
"""
MedInc:该街区住户的收入中位数
HouseAge:该街区房屋使用年代的中位数
AveRooms:该街区平均的房间数目
AveBedrms:该街区平均的卧室数目
Population:街区人口
AveOccup:平均入住率
Latitude:街区的纬度
Longitude:街区的经度
"""
'\nMedInc:该街区住户的收入中位数\nHouseAge:该街区房屋使用年代的中位数\nAveRooms:该街区平均的房间数目\nAveBedrms:该街区平均的卧室数目\nPopulation:街区人口\nAveOccup:平均入住率\nLatitude:街区的纬度\nLongitude:街区的经度\n'
1.3 分训练集和测试集
Xtrain, Xtest, Ytrain, Ytest = train_test_split(X,y,test_size=0.3,random_state=420)
Xtest.head()
|
MedInc |
HouseAge |
AveRooms |
AveBedrms |
Population |
AveOccup |
Latitude |
Longitude |
| 5156 |
1.7656 |
42.0 |
4.144703 |
1.031008 |
1581.0 |
4.085271 |
33.96 |
-118.28 |
| 19714 |
1.5281 |
29.0 |
5.095890 |
1.095890 |
1137.0 |
3.115068 |
39.29 |
-121.68 |
| 18471 |
4.1750 |
14.0 |
5.604699 |
1.045965 |
2823.0 |
2.883555 |
37.14 |
-121.64 |
| 16156 |
3.0278 |
52.0 |
5.172932 |
1.085714 |
1663.0 |
2.500752 |
37.78 |
-122.49 |
| 7028 |
4.5000 |
36.0 |
4.940447 |
0.982630 |
1306.0 |
3.240695 |
33.95 |
-118.09 |
Xtrain.head()
|
MedInc |
HouseAge |
AveRooms |
AveBedrms |
Population |
AveOccup |
Latitude |
Longitude |
| 17073 |
4.1776 |
35.0 |
4.425172 |
1.030683 |
5380.0 |
3.368817 |
37.48 |
-122.19 |
| 16956 |
5.3261 |
38.0 |
6.267516 |
1.089172 |
429.0 |
2.732484 |
37.53 |
-122.30 |
| 20012 |
1.9439 |
26.0 |
5.768977 |
1.141914 |
891.0 |
2.940594 |
36.02 |
-119.08 |
| 13072 |
2.5000 |
22.0 |
4.916000 |
1.012000 |
733.0 |
2.932000 |
38.57 |
-121.31 |
| 8457 |
3.8250 |
34.0 |
5.036765 |
1.098039 |
1134.0 |
2.779412 |
33.91 |
-118.35 |
for i in [Xtrain, Xtest]:
i.index = range(i.shape[0])
Xtrain.shape
(14448, 8)
1.4 建模
reg = LR().fit(Xtrain, Ytrain)
yhat = reg.predict(Xtest)
yhat
array([1.51384887, 0.46566247, 2.2567733 , ..., 2.11885803, 1.76968187,
       0.73219077])
yhat.min()
-0.6528439725035611
yhat.max()
7.1461982142709175
1.5 探索建好的模型
reg.coef_
array([ 4.37358931e-01,  1.02112683e-02, -1.07807216e-01,  6.26433828e-01,
        5.21612535e-07, -3.34850965e-03, -4.13095938e-01, -4.26210954e-01])
Xtrain.columns
Index(['MedInc', 'HouseAge', 'AveRooms', 'AveBedrms', 'Population', 'AveOccup',
       'Latitude', 'Longitude'],
      dtype='object')
[*zip(Xtrain.columns,reg.coef_)]
[('MedInc', 0.4373589305968407),
 ('HouseAge', 0.010211268294494147),
 ('AveRooms', -0.10780721617317636),
 ('AveBedrms', 0.6264338275363747),
 ('Population', 5.21612535296645e-07),
 ('AveOccup', -0.0033485096463334923),
 ('Latitude', -0.4130959378947715),
 ('Longitude', -0.4262109536208473)]
"""
MedInc:该街区住户的收入中位数
HouseAge:该街区房屋使用年代的中位数
AveRooms:该街区平均的房间数目
AveBedrms:该街区平均的卧室数目
Population:街区人口
AveOccup:平均入住率
Latitude:街区的纬度
Longitude:街区的经度
"""
'\nMedInc:该街区住户的收入中位数\nHouseAge:该街区房屋使用年代的中位数\nAveRooms:该街区平均的房间数目\nAveBedrms:该街区平均的卧室数目\nPopulation:街区人口\nAveOccup:平均入住率\nLatitude:街区的纬度\nLongitude:街区的经度\n'
reg.intercept_
-36.25689322920389
2.回归类模型的评估指标
2.1 损失函数
from sklearn.metrics import mean_squared_error as MSE
MSE(yhat,Ytest)
0.5309012639324565
Ytest.mean()
2.0819292877906976
y.max()
5.00001
y.min()
0.14999
cross_val_score(reg,X,y,cv=10,scoring="mean_squared_error")
---------------------------------------------------------------------------
KeyError Traceback (most recent call last)
File D:\py1.1\lib\site-packages\sklearn\metrics\_scorer.py:415, in get_scorer(scoring)
414 try:
--> 415 scorer = copy.deepcopy(_SCORERS[scoring])
416 except KeyError:
KeyError: 'mean_squared_error'
During handling of the above exception, another exception occurred:
ValueError Traceback (most recent call last)
Input In [36], in | ()
----> 1 cross_val_score(reg,X,y,cv=10,scoring="mean_squared_error")
File D:\py1.1\lib\site-packages\sklearn\model_selection\_validation.py:513, in cross_val_score(estimator, X, y, groups, scoring, cv, n_jobs, verbose, fit_params, pre_dispatch, error_score)
395 """Evaluate a score by cross-validation.
396
397 Read more in the :ref:`User Guide `.
(...)
510 [0.3315057 0.08022103 0.03531816]
511 """
512 # To ensure multimetric format is not supported
--> 513 scorer = check_scoring(estimator, scoring=scoring)
515 cv_results = cross_validate(
516 estimator=estimator,
517 X=X,
(...)
526 error_score=error_score,
527 )
528 return cv_results["test_score"]
File D:\py1.1\lib\site-packages\sklearn\metrics\_scorer.py:464, in check_scoring(estimator, scoring, allow_none)
459 raise TypeError(
460 "estimator should be an estimator implementing 'fit' method, %r was passed"
461 % estimator
462 )
463 if isinstance(scoring, str):
--> 464 return get_scorer(scoring)
465 elif callable(scoring):
466 # Heuristic to ensure user has not passed a metric
467 module = getattr(scoring, "__module__", None)
File D:\py1.1\lib\site-packages\sklearn\metrics\_scorer.py:417, in get_scorer(scoring)
415 scorer = copy.deepcopy(_SCORERS[scoring])
416 except KeyError:
--> 417 raise ValueError(
418 "%r is not a valid scoring value. "
419 "Use sklearn.metrics.get_scorer_names() "
420 "to get valid options." % scoring
421 )
422 else:
423 scorer = scoring
ValueError: 'mean_squared_error' is not a valid scoring value. Use sklearn.metrics.get_scorer_names() to get valid options.
|
import sklearn
sorted(sklearn.metrics.SCORERS.keys())
['accuracy',
 'adjusted_mutual_info_score',
 'adjusted_rand_score',
 'average_precision',
 'balanced_accuracy',
 'completeness_score',
 'explained_variance',
 'f1',
 'f1_macro',
 'f1_micro',
 'f1_samples',
 'f1_weighted',
 'fowlkes_mallows_score',
 'homogeneity_score',
 'jaccard',
 'jaccard_macro',
 'jaccard_micro',
 'jaccard_samples',
 'jaccard_weighted',
 'matthews_corrcoef',
 'max_error',
 'mutual_info_score',
 'neg_brier_score',
 'neg_log_loss',
 'neg_mean_absolute_error',
 'neg_mean_absolute_percentage_error',
 'neg_mean_gamma_deviance',
 'neg_mean_poisson_deviance',
 'neg_mean_squared_error',
 'neg_mean_squared_log_error',
 'neg_median_absolute_error',
 'neg_root_mean_squared_error',
 'normalized_mutual_info_score',
 'precision',
 'precision_macro',
 'precision_micro',
 'precision_samples',
 'precision_weighted',
 'r2',
 'rand_score',
 'recall',
 'recall_macro',
 'recall_micro',
 'recall_samples',
 'recall_weighted',
 'roc_auc',
 'roc_auc_ovo',
 'roc_auc_ovo_weighted',
 'roc_auc_ovr',
 'roc_auc_ovr_weighted',
 'top_k_accuracy',
 'v_measure_score']
cross_val_score(reg,X,y,cv=10,scoring="neg_mean_squared_error")
array([-0.48922052, -0.43335865, -0.8864377 , -0.39091641, -0.7479731 ,
       -0.52980278, -0.28798456, -0.77326441, -0.64305557, -0.3275106 ])
cross_val_score(reg,X,y,cv=10,scoring="neg_mean_squared_error").mean()
-0.5509524296956585
2.2 成功拟合信息量占比
from sklearn.metrics import r2_score
r2_score(yhat,Ytest)
0.3380653761556045
r2 = reg.score(Xtest,Ytest)
r2
0.6043668160178821
r2_score(Ytest,yhat)
0.6043668160178821
r2_score(y_true = Ytest,y_pred = yhat)
0.6043668160178821
cross_val_score(reg,X,y,cv=10,scoring="r2")
array([0.48254494, 0.61416063, 0.42274892, 0.48178521, 0.55705986,
       0.5412919 , 0.47496038, 0.45844938, 0.48177943, 0.59528796])
cross_val_score(reg,X,y,cv=10,scoring="r2").mean()
0.5110068610524557
import matplotlib.pyplot as plt
sorted(Ytest)
[0.14999,
 0.14999,
 0.225,
 0.325,
 0.35,
 0.375,
 0.388,
 0.392,
 0.394,
 0.396,
 0.4,
 0.404,
 0.409,
 0.41,
 0.43,
 0.435,
 0.437,
 0.439,
 0.44,
 0.44,
 0.444,
 0.446,
 0.45,
 0.45,
 0.45,
 0.45,
 0.455,
 0.455,
 0.455,
 0.456,
 0.462,
 0.463,
 0.471,
 0.475,
 0.478,
 0.478,
 0.481,
 0.481,
 0.483,
 0.483,
 0.485,
 0.485,
 0.488,
 0.489,
 0.49,
 0.492,
 0.494,
 0.494,
 0.494,
 0.495,
 0.496,
 0.5,
 0.5,
 0.504,
 0.505,
 0.506,
 0.506,
 0.508,
 0.508,
 0.51,
 0.516,
 0.519,
 0.52,
 0.521,
 0.523,
 0.523,
 0.525,
 0.525,
 0.525,
 0.525,
 0.525,
 0.527,
 0.527,
 0.528,
 0.529,
 0.53,
 0.531,
 0.532,
 0.534,
 0.535,
 0.535,
 0.535,
 0.538,
 0.538,
 0.539,
 0.539,
 0.539,
 0.541,
 0.541,
 0.542,
 0.542,
 0.542,
 0.543,
 0.543,
 0.544,
 0.544,
 0.546,
 0.547,
 0.55,
 0.55,
 0.55,
 0.55,
 0.55,
 0.55,
 0.55,
 0.55,
 0.551,
 0.553,
 0.553,
 0.553,
 0.554,
 0.554,
 0.554,
 0.555,
 0.556,
 0.556,
 0.557,
 0.558,
 0.558,
 0.559,
 0.559,
 0.559,
 0.559,
 0.56,
 0.56,
 0.562,
 0.566,
 0.567,
 0.567,
 0.567,
 0.567,
 0.567,
 0.568,
 0.57,
 0.571,
 0.572,
 0.574,
 0.574,
 0.575,
 0.575,
 0.575,
 0.575,
 0.576,
 0.577,
 0.577,
 0.577,
 0.578,
 0.579,
 0.579,
 0.579,
 0.58,
 0.58,
 0.58,
 0.58,
 0.58,
 0.58,
 0.581,
 0.581,
 0.581,
 0.581,
 0.582,
 0.583,
 0.583,
 0.583,
 0.583,
 0.584,
 0.586,
 0.586,
 0.587,
 0.588,
 0.588,
 0.59,
 0.59,
 0.59,
 0.59,
 0.591,
 0.591,
 0.593,
 0.593,
 0.594,
 0.594,
 0.594,
 0.594,
 0.595,
 0.596,
 0.596,
 0.597,
 0.598,
 0.598,
 0.6,
 0.6,
 0.6,
 0.602,
 0.602,
 0.603,
 0.604,
 0.604,
 0.604,
 0.605,
 0.606,
 0.606,
 0.608,
 0.608,
 0.608,
 0.609,
 0.609,
 0.611,
 0.612,
 0.612,
 0.613,
 0.613,
 0.613,
 0.614,
 0.615,
 0.616,
 0.616,
 0.616,
 0.616,
 0.618,
 0.618,
 0.618,
 0.619,
 0.619,
 0.62,
 0.62,
 0.62,
 0.62,
 0.62,
 0.62,
 0.62,
 0.62,
 0.621,
 0.621,
 0.621,
 0.622,
 0.623,
 0.625,
 0.625,
 0.625,
 0.627,
 0.627,
 0.628,
 0.628,
 0.629,
 0.63,
 0.63,
 0.63,
 0.63,
 0.631,
 0.631,
 0.632,
 0.632,
 0.633,
 0.633,
 0.633,
 0.634,
 0.634,
 0.635,
 0.635,
 0.635,
 0.635,
 0.635,
 0.637,
 0.637,
 0.637,
 0.637,
 0.638,
 0.639,
 0.643,
 0.644,
 0.644,
 0.646,
 0.646,
 0.646,
 0.646,
 0.647,
 0.647,
 0.647,
 0.648,
 0.65,
 0.65,
 0.65,
 0.652,
 0.652,
 0.654,
 0.654,
 0.654,
 0.655,
 0.656,
 0.656,
 0.656,
 0.656,
 0.657,
 0.658,
 0.658,
 0.659,
 0.659,
 0.659,
 0.659,
 0.659,
 0.66,
 0.661,
 0.661,
 0.662,
 0.662,
 0.663,
 0.664,
 0.664,
 0.664,
 0.668,
 0.669,
 0.669,
 0.67,
 0.67,
 0.67,
 0.67,
 0.67,
 0.67,
 0.672,
 0.672,
 0.672,
 0.673,
 0.673,
 0.674,
 0.675,
 0.675,
 0.675,
 0.675,
 0.675,
 0.675,
 0.675,
 0.675,
 0.675,
 0.675,
 0.675,
 0.675,
 0.675,
 0.676,
 0.676,
 0.677,
 0.678,
 0.68,
 0.68,
 0.681,
 0.682,
 0.682,
 0.682,
 0.682,
 0.683,
 0.683,
 0.683,
 0.684,
 0.684,
 0.685,
 0.685,
 0.685,
 0.685,
 0.686,
 0.686,
 0.687,
 0.688,
 0.689,
 0.689,
 0.689,
 0.69,
 0.69,
 0.691,
 0.691,
 0.692,
 0.693,
 0.694,
 0.694,
 0.694,
 0.694,
 0.694,
 0.695,
 0.695,
 0.695,
 0.696,
 0.696,
 0.697,
 0.698,
 0.699,
 0.699,
 0.7,
 0.7,
 0.7,
 0.7,
 0.7,
 0.7,
 0.701,
 0.701,
 0.701,
 0.702,
 0.702,
 0.703,
 0.704,
 0.704,
 0.705,
 0.705,
 0.706,
 0.707,
 0.707,
 0.707,
 0.708,
 0.709,
 0.71,
 0.71,
 0.71,
 0.711,
 0.712,
 0.712,
 0.713,
 0.713,
 0.713,
 0.714,
 0.715,
 0.716,
 0.718,
 0.719,
 0.72,
 0.72,
 0.72,
 0.721,
 0.722,
 0.723,
 0.723,
 0.723,
 0.723,
 0.723,
 0.725,
 0.725,
 0.727,
 0.727,
 0.728,
 0.729,
 0.729,
 0.73,
 0.73,
 0.73,
 0.73,
 0.73,
 0.731,
 0.731,
 0.731,
 0.731,
 0.732,
 0.733,
 0.733,
 0.734,
 0.735,
 0.735,
 0.737,
 0.738,
 0.738,
 0.738,
 0.74,
 0.74,
 0.74,
 0.741,
 0.741,
 0.741,
 0.743,
 0.746,
 0.746,
 0.747,
 0.748,
 0.749,
 0.75,
 0.75,
 0.75,
 0.75,
 0.75,
 0.75,
 0.75,
 0.752,
 0.752,
 0.754,
 0.756,
 0.756,
 0.757,
 0.759,
 0.759,
 0.759,
 0.76,
 0.76,
 0.761,
 0.762,
 0.762,
 0.762,
 0.762,
 0.763,
 0.764,
 0.764,
 0.765,
 0.766,
 0.768,
 0.769,
 0.77,
 0.771,
 0.771,
 0.771,
 0.772,
 0.772,
 0.773,
 0.774,
 0.774,
 0.775,
 0.777,
 0.777,
 0.779,
 0.78,
 0.78,
 0.78,
 0.781,
 0.783,
 0.783,
 0.785,
 0.786,
 0.786,
 0.786,
 0.786,
 0.788,
 0.788,
 0.788,
 0.788,
 0.788,
 0.79,
 0.79,
 0.79,
 0.792,
 0.792,
 0.792,
 0.795,
 0.795,
 0.795,
 0.797,
 0.797,
 0.798,
 0.799,
 0.8,
 0.801,
 0.802,
 0.803,
 0.804,
 0.804,
 0.804,
 0.806,
 0.806,
 0.808,
 0.808,
 0.808,
 0.809,
 0.81,
 0.81,
 0.811,
 0.813,
 0.813,
 0.813,
 0.813,
 0.813,
 0.813,
 0.813,
 0.813,
 0.813,
 0.813,
 0.813,
 0.813,
 0.813,
 0.813,
 0.814,
 0.814,
 0.816,
 0.817,
 0.817,
 0.817,
 0.821,
 0.821,
 0.821,
 0.823,
 0.823,
 0.824,
 0.825,
 0.825,
 0.825,
 0.826,
 0.827,
 0.827,
 0.828,
 0.828,
 0.828,
 0.83,
 0.83,
 0.83,
 0.831,
 0.831,
 0.831,
 0.832,
 0.832,
 0.832,
 0.833,
 0.833,
 0.834,
 0.835,
 0.835,
 0.836,
 0.836,
 0.837,
 0.838,
 0.839,
 0.839,
 0.839,
 0.839,
 0.84,
 0.841,
 0.842,
 0.842,
 0.842,
 0.843,
 0.843,
 0.844,
 0.844,
 0.844,
 0.845,
 0.845,
 0.845,
 0.845,
 0.846,
 0.846,
 0.846,
 0.846,
 0.847,
 0.847,
 0.847,
 0.847,
 0.847,
 0.847,
 0.848,
 0.849,
 0.849,
 0.85,
 0.85,
 0.85,
 0.851,
 0.851,
 0.851,
 0.851,
 0.852,
 0.853,
 0.853,
 0.854,
 0.854,
 0.854,
 0.855,
 0.855,
 0.855,
 0.855,
 0.856,
 0.857,
 0.857,
 0.857,
 0.857,
 0.857,
 0.858,
 0.859,
 0.859,
 0.859,
 0.859,
 0.859,
 0.861,
 0.862,
 0.863,
 0.863,
 0.863,
 0.864,
 0.864,
 0.864,
 0.864,
 0.865,
 0.865,
 0.865,
 0.866,
 0.867,
 0.867,
 0.868,
 0.869,
 0.869,
 0.869,
 0.869,
 0.87,
 0.87,
 0.871,
 0.871,
 0.872,
 0.872,
 0.872,
 0.873,
 0.874,
 0.875,
 0.875,
 0.875,
 0.875,
 0.875,
 0.875,
 0.875,
 0.875,
 0.875,
 0.875,
 0.875,
 0.875,
 0.875,
 0.875,
 0.875,
 0.875,
 0.875,
 0.875,
 0.875,
 0.875,
 0.875,
 0.875,
 0.875,
 0.875,
 0.876,
 0.876,
 0.877,
 0.877,
 0.878,
 0.878,
 0.878,
 0.879,
 0.879,
 0.879,
 0.88,
 0.88,
 0.881,
 0.881,
 0.882,
 0.882,
 0.882,
 0.882,
 0.883,
 0.883,
 0.883,
 0.883,
 0.883,
 0.883,
 0.884,
 0.885,
 0.885,
 0.886,
 0.887,
 0.887,
 0.887,
 0.888,
 0.888,
 0.888,
 0.889,
 0.889,
 0.889,
 0.889,
 0.889,
 0.89,
 0.891,
 0.892,
 0.892,
 0.892,
 0.893,
 0.893,
 0.894,
 0.895,
 0.896,
 0.896,
 0.897,
 0.897,
 0.898,
 0.898,
 0.899,
 0.9,
 0.9,
 0.9,
 0.901,
 0.901,
 0.901,
 0.902,
 0.903,
 0.903,
 0.904,
 0.904,
 0.904,
 0.905,
 0.905,
 0.905,
 0.905,
 0.906,
 0.906,
 0.906,
 0.906,
 0.907,
 0.907,
 0.908,
 0.911,
 0.911,
 0.912,
 0.914,
 0.915,
 0.915,
 0.916,
 0.916,
 0.917,
 0.917,
 0.917,
 0.917,
 0.918,
 0.918,
 0.918,
 0.919,
 0.919,
 0.919,
 0.92,
 0.92,
 0.922,
 0.922,
 0.922,
 0.922,
 0.922,
 0.924,
 0.925,
 0.925,
 0.925,
 0.925,
 0.926,
 0.926,
 0.926,
 0.926,
 0.926,
 0.926,
 0.926,
 0.926,
 0.926,
 0.926,
 0.927,
 0.927,
 0.927,
 0.927,
 0.928,
 0.928,
 0.928,
 0.928,
 0.928,
 0.929,
 0.93,
 0.93,
 0.931,
 0.931,
 0.931,
 0.931,
 0.931,
 0.931,
 0.932,
 0.932,
 0.932,
 0.932,
 0.933,
 0.933,
 0.933,
 0.934,
 0.934,
 0.934,
 0.934,
 0.934,
 0.935,
 0.935,
 0.935,
 0.936,
 0.936,
 0.936,
 0.936,
 0.938,
 0.938,
 0.938,
 0.938,
 0.938,
 0.938,
 0.938,
 0.938,
 0.938,
 0.938,
 0.938,
 0.939,
 0.939,
 0.94,
 0.94,
 0.942,
 0.942,
 0.943,
 0.943,
 0.944,
 0.944,
 0.944,
 0.945,
 0.945,
 0.946,
 0.946,
 0.946,
 0.946,
 0.946,
 0.946,
 0.946,
 0.947,
 0.947,
 0.948,
 0.948,
 0.948,
 0.949,
 0.949,
 0.95,
 0.95,
 0.95,
 0.95,
 0.95,
 0.951,
 0.952,
 0.952,
 0.953,
 0.953,
 0.953,
 0.953,
 0.954,
 0.955,
 0.955,
 0.955,
 0.955,
 0.955,
 0.956,
 0.957,
 0.957,
 0.957,
 0.958,
 0.958,
 0.958,
 0.958,
 0.958,
 0.958,
 0.96,
 0.96,
 0.96,
 0.96,
 0.96,
 0.96,
 0.961,
 0.961,
 0.962,
 0.962,
 0.962,
 0.962,
 0.962,
 0.962,
 0.962,
 0.963,
 0.964,
 0.964,
 0.964,
 0.964,
 0.965,
 0.965,
 0.965,
 0.966,
 0.966,
 0.966,
 0.967,
 0.967,
 0.967,
 0.968,
 0.968,
 0.969,
 0.969,
 0.969,
 0.969,
 0.97,
 0.971,
 0.972,
 0.972,
 0.973,
 0.973,
 0.973,
 0.974,
 0.974,
 0.974,
 0.974,
 0.976,
 0.976,
 0.976,
 0.976,
 0.977,
 0.977,
 0.978,
 0.978,
 0.978,
 0.979,
 0.979,
 ...]
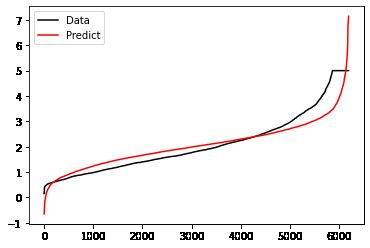
plt.plot(range(len(Ytest)),sorted(Ytest),c="black",label= "Data")
plt.plot(range(len(yhat)),sorted(yhat),c="red",label = "Predict")
plt.legend()
plt.show()
import numpy as np
rng = np.random.RandomState(42)
X = rng.randn(100, 80)
y = rng.randn(100)
X.shape
(100, 80)
y.shape
(100,)
cross_val_score(LR(), X, y, cv=5, scoring='r2')
array([-178.71468148,   -5.64707178,  -15.13900541,  -77.74877079,
        -60.3727755 ])
3. 多重共线性
4. 岭回归
4.1 岭回归解决多重共线性问题及参数Ridge
import numpy as np
import pandas as pd
from sklearn.linear_model import Ridge, LinearRegression, Lasso
from sklearn.model_selection import train_test_split as TTS
from sklearn.datasets import fetch_california_housing as fch
import matplotlib.pyplot as plt
housevalue = fch()
X = pd.DataFrame(housevalue.data)
y = housevalue.target
X.columns = ["住户收入中位数","房屋使用年代中位数","平均房间数目"
,"平均卧室数目","街区人口","平均入住率","街区的纬度","街区的经度"]
X.head()
|
住户收入中位数 |
房屋使用年代中位数 |
平均房间数目 |
平均卧室数目 |
街区人口 |
平均入住率 |
街区的纬度 |
街区的经度 |
| 0 |
8.3252 |
41.0 |
6.984127 |
1.023810 |
322.0 |
2.555556 |
37.88 |
-122.23 |
| 1 |
8.3014 |
21.0 |
6.238137 |
0.971880 |
2401.0 |
2.109842 |
37.86 |
-122.22 |
| 2 |
7.2574 |
52.0 |
8.288136 |
1.073446 |
496.0 |
2.802260 |
37.85 |
-122.24 |
| 3 |
5.6431 |
52.0 |
5.817352 |
1.073059 |
558.0 |
2.547945 |
37.85 |
-122.25 |
| 4 |
3.8462 |
52.0 |
6.281853 |
1.081081 |
565.0 |
2.181467 |
37.85 |
-122.25 |
Xtrain,Xtest,Ytrain,Ytest = TTS(X,y,test_size=0.3,random_state=420)
for i in [Xtrain,Xtest]:
    i.index = range(i.shape[0])
Xtrain.head()
|
住户收入中位数 |
房屋使用年代中位数 |
平均房间数目 |
平均卧室数目 |
街区人口 |
平均入住率 |
街区的纬度 |
街区的经度 |
| 0 |
4.1776 |
35.0 |
4.425172 |
1.030683 |
5380.0 |
3.368817 |
37.48 |
-122.19 |
| 1 |
5.3261 |
38.0 |
6.267516 |
1.089172 |
429.0 |
2.732484 |
37.53 |
-122.30 |
| 2 |
1.9439 |
26.0 |
5.768977 |
1.141914 |
891.0 |
2.940594 |
36.02 |
-119.08 |
| 3 |
2.5000 |
22.0 |
4.916000 |
1.012000 |
733.0 |
2.932000 |
38.57 |
-121.31 |
| 4 |
3.8250 |
34.0 |
5.036765 |
1.098039 |
1134.0 |
2.779412 |
33.91 |
-118.35 |
reg = Ridge(alpha=1).fit(Xtrain,Ytrain)
reg.score(Xtest,Ytest)
0.6043610352312286
alpharange = np.arange(1,1001,100)
ridge, lr = [], []
for alpha in alpharange:
reg = Ridge(alpha=alpha)
linear = LinearRegression()
regs = cross_val_score(reg,X,y,cv=5,scoring = "r2").mean()
linears = cross_val_score(linear,X,y,cv=5,scoring = "r2").mean()
ridge.append(regs)
lr.append(linears)
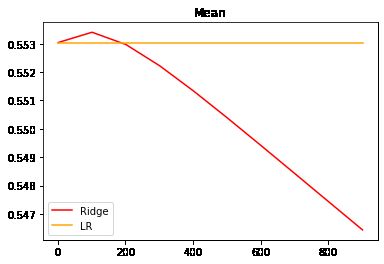
plt.plot(alpharange,ridge,color="red",label="Ridge")
plt.plot(alpharange,lr,color="orange",label="LR")
plt.title("Mean")
plt.legend()
plt.show()
reg = Ridge(alpha=101).fit(Xtrain,Ytrain)
reg.score(Xtest,Ytest)
0.6035230850669475
alpharange = np.arange(1,201,10)
ridge, lr = [], []
for alpha in alpharange:
reg = Ridge(alpha=alpha)
linear = LinearRegression()
regs = cross_val_score(reg,X,y,cv=5,scoring = "r2").mean()
linears = cross_val_score(linear,X,y,cv=5,scoring = "r2").mean()
ridge.append(regs)
lr.append(linears)
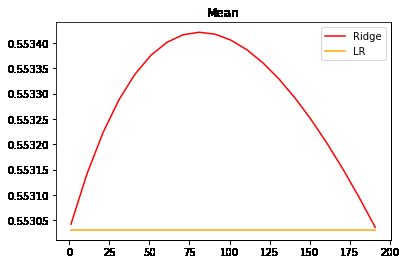
plt.plot(alpharange,ridge,color="red",label="Ridge")
plt.plot(alpharange,lr,color="orange",label="LR")
plt.title("Mean")
plt.legend()
plt.show()
alpharange = np.arange(1,1001,100)
ridge, lr = [], []
for alpha in alpharange:
reg = Ridge(alpha=alpha)
linear = LinearRegression()
varR = cross_val_score(reg,X,y,cv=5,scoring="r2").var()
varLR = cross_val_score(linear,X,y,cv=5,scoring="r2").var()
ridge.append(varR)
lr.append(varLR)
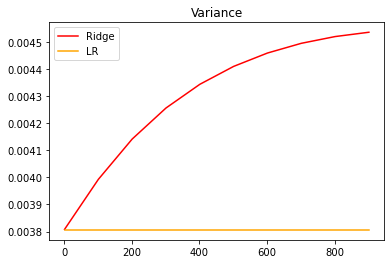
plt.plot(alpharange,ridge,color="red",label="Ridge")
plt.plot(alpharange,lr,color="orange",label="LR")
plt.title("Variance")
plt.legend()
plt.show()
from sklearn.datasets import load_boston
from sklearn.model_selection import cross_val_score

X = load_boston().data
y = load_boston().target

Xtrain,Xtest,Ytrain,Ytest = TTS(X,y,test_size=0.3,random_state=420)
X.shape
(506, 13)
alpharange = np.arange(1,1001,100)
ridge, lr = [], []
for alpha in alpharange:
reg = Ridge(alpha=alpha)
linear = LinearRegression()
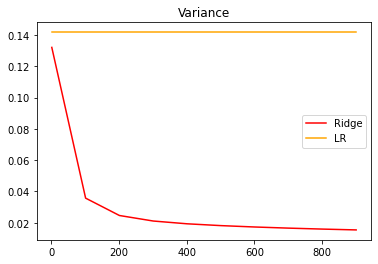
varR = cross_val_score(reg,X,y,cv=5,scoring="r2").var()
varLR = cross_val_score(linear,X,y,cv=5,scoring="r2").var()
ridge.append(varR)
lr.append(varLR)
plt.plot(alpharange,ridge,color="red",label="Ridge")
plt.plot(alpharange,lr,color="orange",label="LR")
plt.title("Variance")
plt.legend()
plt.show()
alpharange = np.arange(1,1001,100)
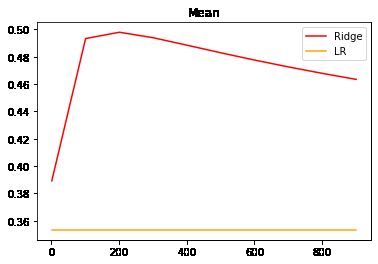
ridge, lr = [], []
for alpha in alpharange:
reg = Ridge(alpha=alpha)
linear = LinearRegression()
regs = cross_val_score(reg,X,y,cv=5,scoring = "r2").mean()
linears = cross_val_score(linear,X,y,cv=5,scoring = "r2").mean()
ridge.append(regs)
lr.append(linears)
plt.plot(alpharange,ridge,color="red",label="Ridge")
plt.plot(alpharange,lr,color="orange",label="LR")
plt.title("Mean")
plt.legend()
plt.show()
alpharange = np.arange(100,300,10)
ridge, lr = [], []
for alpha in alpharange:
reg = Ridge(alpha=alpha)
regs = cross_val_score(reg,X,y,cv=5,scoring = "r2").mean()
ridge.append(regs)
lr.append(linears)
plt.plot(alpharange,ridge,color="red",label="Ridge")
plt.title("Mean")
plt.legend()
plt.show()
4.2 选取最佳的正则化参数取值
import numpy as np
import pandas as pd
from sklearn.linear_model import RidgeCV, LinearRegression
from sklearn.model_selection import train_test_split as TTS
from sklearn.datasets import fetch_california_housing as fch
import matplotlib.pyplot as plt
housevalue = fch()
X = pd.DataFrame(housevalue.data)
y = housevalue.target
X.columns = ["住户收入中位数","房屋使用年代中位数","平均房间数目"
,"平均卧室数目","街区人口","平均入住率","街区的纬度","街区的经度"]
Ridge_ = RidgeCV(alphas=np.arange(1,1001,100)
,store_cv_values=True
).fit(X, y)
Ridge_.score(X,y)
0.6060251767338389
Ridge_.cv_values_
array([[0.1557472 , 0.16301246, 0.16892723, ..., 0.18881663, 0.19182353,
        0.19466385],
       [0.15334566, 0.13922075, 0.12849014, ..., 0.09744906, 0.09344092,
        0.08981868],
       [0.02429857, 0.03043271, 0.03543001, ..., 0.04971514, 0.05126165,
        0.05253834],
       ...,
       [0.56545783, 0.5454654 , 0.52655917, ..., 0.44532597, 0.43130136,
        0.41790336],
       [0.27883123, 0.2692305 , 0.25944481, ..., 0.21328675, 0.20497018,
        0.19698274],
       [0.14313527, 0.13967826, 0.13511341, ..., 0.1078647 , 0.10251737,
        0.0973334 ]])
Ridge_.cv_values_.shape
(20640, 10)
Ridge_.cv_values_.mean(axis=0)
array([0.52823795, 0.52787439, 0.52807763, 0.52855759, 0.52917958,
       0.52987689, 0.53061486, 0.53137481, 0.53214638, 0.53292369])
Ridge_.alpha_
101


