Matplotlib画图
文章目录
-
- 添加子图
- 设置中文正常显示
- 画图中的各种属性,标题,坐标轴等
- 图例 plt.legend()
-
- 图例位置 参数 loc
- 动态参数 rc
-
- rc参数设置
- 3 设置x轴的刻度标签旋转 ax.set_xticklabels()
- 4 添加文本注解
- 折线图 plot()
- color常用颜色缩写
- 6.1 简单的折线图绘制
- 6.2 带点的折线图
- 散点图
- 8 直方图
- 饼图
- 10 箱线图
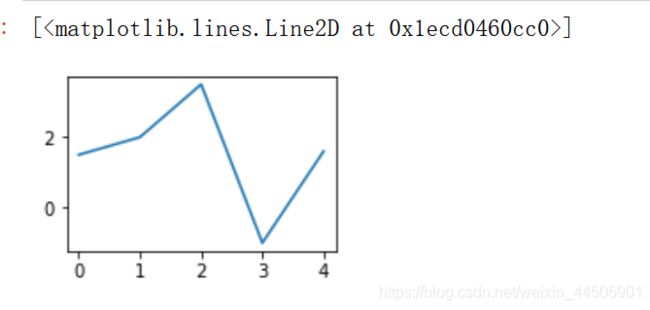
import matplotlib.pyplot as plt
fig = plt.figure()
ax1=fig.add_subplot(2,2,1)

ax1.plot([1.5,2,3.5,-1,1.6])
添加子图
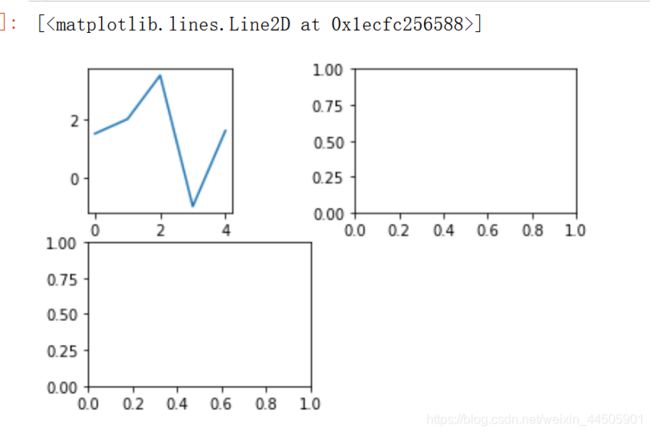
import matplotlib.pyplot as plt
fig = plt.figure()
ax1=fig.add_subplot(2,3,1)
ax2=fig.add_subplot(2,2,2)
ax3=fig.add_subplot(2,2,3)

ax1.plot([1.5,2,3.5,-1,1.6])
import matplotlib.pyplot as plt
fig,axes = plt.subplots(2,3)
fig
axes
array([[, , ],
       [, , ]], dtype=object)
import numpy as np

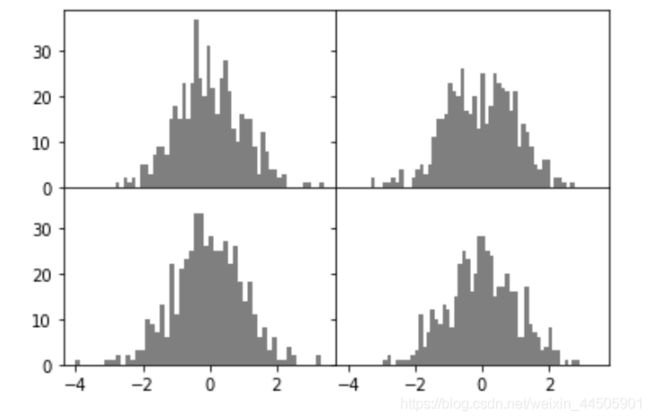
fig,axes = plt.subplots(2,2, sharex=True, sharey=True)
# sharex=True, sharey=True 表明子图分别拥有相同的X轴和Y 轴
for i in range(2):
    for j in range(2):
        axes[i,j].hist(np.random.randn(500), bins=50, color='k', alpha=0.5)


plt.subplots_adjust(wspace=0,hspace=0) # 调整子图布局
np.random.randn(500)
array([ 1.40173830e-01, -1.51707350e+00,  1.39185937e+00, -1.97640383e+00,
       -3.39519794e-02, -7.16051300e-01, -1.96734297e+00,  4.41397803e-01,
       -3.54249851e-02, -1.23419437e+00, -2.07707373e+00,  1.45725074e+00,
       -1.82340411e+00,  1.24400616e+00,  2.23019501e+00,  9.53141573e-01,
        1.91924455e-01, -9.83934817e-01,  7.45528318e-01,  3.58465779e-01,
        8.58476940e-01, -1.56643312e+00, -4.78568440e-01,  8.43609530e-01,
        5.67833515e-01, -4.13951905e-01,  6.92299425e-02,  6.68577581e-03,
        9.66596726e-01,  1.18542118e+00,  1.33405347e+00, -3.92810749e-01,
       -8.14756753e-01,  1.06847287e+00, -8.34055363e-01, -3.75085309e-01,
        1.18472318e+00,  2.35505146e-01, -2.39231650e-01,  1.11510290e+00,
       -1.52161266e+00, -6.61069050e-01,  8.09971170e-01,  1.96516422e-01,
        3.41650877e-01, -1.47726381e-01, -4.47427247e-01,  8.94506573e-01,
       -1.56604182e+00, -8.95701416e-02, -6.46870508e-01,  2.58382284e+00,
       -2.43023908e-01,  5.78866358e-01, -7.38223565e-02, -7.53642816e-01,
       -3.04183305e-01,  9.45279650e-01, -7.75617855e-01,  2.57291318e-01,
       -5.94119732e-01, -6.65526696e-01, -1.10643422e-01, -5.50861881e-01,
       -3.93860993e-01,  5.39317557e-01, -1.26042943e+00,  9.43565141e-01,
        2.16103450e-01, -6.42174009e-01,  2.25007764e-01,  5.95124483e-01,
       -4.47607371e-01,  1.48597075e+00,  1.75550669e+00, -4.94055574e-01,
        7.65330796e-01, -8.57648043e-01, -5.01919865e-02, -3.23592719e-01,
        1.40217758e+00, -1.93750128e-01,  2.84038233e+00, -3.00424900e-01,
        1.88014534e-01, -3.56695825e-01, -2.23229769e+00, -6.43761120e-01,
       -7.13892508e-01,  9.37042045e-01,  1.80289893e+00,  1.80266626e+00,
       -1.47476948e-01,  9.50917744e-01, -7.03016036e-01,  4.03772976e-01,
       -1.38258999e+00,  2.37404720e-01, -6.26548901e-01, -9.62629245e-01,
       -1.28571706e+00,  2.62239244e-01, -5.31095120e-01, -6.08677261e-01,
       -1.28509427e+00,  1.80493671e+00,  1.23070685e+00, -7.20455567e-01,
       -1.25724915e-01,  9.85746134e-01, -2.69093272e-01, -1.11844831e+00,
       -5.51992453e-04, -1.27961942e+00,  9.13856139e-01, -2.90700253e-01,
       -3.15571099e-01, -4.13728335e-01,  6.97875400e-01,  1.67608253e-01,
        1.18965256e+00,  8.03623484e-01,  8.99543190e-01,  1.04134340e+00,
        1.44127852e+00, -2.44671162e-01,  1.78313271e-01,  2.75102897e-02,
       -1.04176937e+00, -1.52001895e+00,  1.38384285e+00,  1.79181688e+00,
       -1.06997524e+00,  8.09623742e-01, -8.50109220e-01,  9.47536394e-01,
       -6.02680496e-01, -1.70036317e+00, -8.08488297e-01, -1.84328779e+00,
        8.52415722e-01,  3.90489830e-02,  9.01047808e-01,  6.83755806e-01,
        3.91369193e-01,  1.31077752e+00,  1.21891079e-01,  4.66536926e-01,
       -3.50250862e-01,  2.53381508e-01,  1.02039159e+00,  7.82985967e-01,
        1.00394917e+00, -2.84213625e-01, -7.38342411e-01, -2.02938881e+00,
       -8.46142541e-01,  6.67226228e-01, -7.01643465e-01, -1.34897851e+00,
        6.46612918e-01, -5.05918261e-01,  9.26586152e-01, -1.54236685e-01,
        1.64474379e+00,  7.40270479e-01,  1.48544058e-02,  2.42920809e-01,
       -1.95947981e-01, -6.39190766e-01, -1.89380917e+00, -2.57628192e-01,
       -5.37949598e-02, -1.26468012e+00, -9.06015950e-01, -3.23538910e-01,
       -1.32822823e-01, -2.23917187e-01, -1.84379470e+00,  3.71468121e-01,
       -9.53087370e-01, -1.52043979e+00,  1.29639193e+00, -1.69206086e+00,
        6.37719505e-01, -5.28327277e-01, -4.33223713e-01, -8.01389653e-02,
        1.47721629e-01, -1.26488061e-01,  4.80136836e-01, -1.29702898e+00,
       -1.94955933e-01,  8.10646524e-02,  9.35967855e-01,  5.75921826e-01,
       -9.82295898e-01,  4.51714285e-01, -8.39439214e-01,  4.29242381e-01,
       -2.16920830e+00, -2.68864198e-01,  6.67019711e-01,  1.42447461e+00,
       -3.77065041e-01,  1.83294881e+00,  7.23357866e-02, -8.86110822e-01,
        9.89552206e-01,  1.57651171e+00, -3.23554852e-01, -6.18937866e-01,
        4.89144312e-01,  3.88055668e-02, -1.21078447e-01, -1.39714587e-01,
       -4.79526802e-01,  2.05420489e+00, -5.32661900e-01,  1.77948567e+00,
        1.12146646e+00, -5.72678536e-01,  1.41646719e+00, -4.82750042e-01,
        1.19242772e+00, -1.08907406e+00, -1.92452026e-01, -3.22658227e-01,
        9.93559623e-01, -1.00060053e+00,  1.55075787e-01,  5.87648235e-01,
        1.42004876e+00, -3.81087976e-01, -6.17061837e-01, -4.78625097e-01,
        6.65056775e-01,  2.56750583e-01, -7.05506146e-01,  8.55169453e-01,
       -2.71371804e-01,  1.27981455e+00, -5.83262865e-01,  8.72871755e-01,
        1.31627980e+00,  7.44079065e-01,  1.39709418e+00,  6.78621377e-01,
        9.16608874e-01, -5.11824140e-01,  1.39683883e+00, -1.05923408e+00,
        6.19613758e-01, -3.35308359e-01, -4.63985106e-01, -8.43537425e-01,
       -5.34153858e-01, -1.11492655e+00,  2.06846022e+00,  1.11077907e+00,
        3.55366148e-01,  1.14077862e+00,  4.32859795e-01, -6.47302017e-02,
        2.20713962e+00, -6.58588166e-01, -5.21634203e-01,  3.21029121e-01,
       -5.92876698e-01, -4.38580717e-02,  2.11007451e-01, -1.50444112e+00,
        8.67769904e-01,  9.02262230e-01,  7.60216884e-01, -5.73595684e-01,
        1.26579682e+00, -3.02726525e-01, -2.82805398e-01, -1.45951674e+00,
        1.35539828e+00,  3.59132010e-01,  3.60376618e-01,  9.63350561e-01,
       -6.50351390e-01,  5.49832163e-01, -6.17158600e-01, -6.12879848e-01,
        1.38910043e+00, -8.94261697e-01, -4.35654143e-01, -9.84024929e-01,
        1.79842346e+00, -4.89121879e-01, -2.46011145e+00,  9.81701177e-02,
       -4.33935971e-01, -2.79862436e-01,  6.52278780e-01, -2.72287379e-01,
        7.79994859e-01,  9.15203018e-01, -3.43617629e-01, -5.16454805e-01,
        9.48946292e-01, -7.92274293e-02,  9.17096772e-01, -7.87327345e-01,
       -3.99078367e-01,  1.99140985e-01, -1.11169577e+00,  5.82789806e-01,
       -7.75615790e-01, -8.21897546e-01, -9.17825973e-02,  9.93783098e-01,
       -1.15840557e+00,  3.01200596e-01, -2.78132053e+00, -9.96414984e-01,
        3.74045417e-01, -9.15466797e-01, -1.77845011e-02,  5.80132319e-01,
        6.41505345e-01, -2.04006481e-01, -1.19168495e+00, -8.99354716e-01,
       -5.70895072e-01,  5.61370392e-01,  7.01906307e-01, -7.52595021e-01,
       -5.59703659e-01, -8.42267288e-01, -1.81850706e+00, -2.12615415e-01,
       -2.29561027e+00, -7.13015838e-01, -4.94679307e-01,  2.01011054e+00,
       -1.30865081e-01, -7.41768431e-01,  2.00841687e+00, -8.43235410e-01,
        5.83482231e-01, -5.37452924e-01,  8.14967666e-01, -5.13946183e-01,
        1.72800050e+00,  2.04186017e-01, -1.46971629e-01,  1.91908253e-01,
        6.12634170e-01,  2.43602136e-01,  4.12558201e-01,  1.11403056e+00,
       -6.93383037e-01,  5.72712132e-01,  1.42736243e+00, -3.00333543e-01,
       -2.69034502e-01, -1.30358808e+00, -2.22810412e+00,  1.40527886e+00,
        9.58755068e-01,  9.43299046e-01, -2.21732440e-01,  1.13783547e-01,
        6.95779230e-01,  6.20395878e-01, -2.23809244e-01,  3.93429604e-01,
        2.67255758e-01,  1.01038798e+00, -1.82677062e-01,  1.21753062e+00,
       -2.18383503e+00,  2.65688472e-01,  5.59807344e-01,  2.09562270e-01,
       -3.29458108e-01, -8.11714007e-01, -4.37788668e-02,  3.91063610e-01,
       -1.54449542e+00, -1.19147736e-01,  8.83266157e-01, -5.05017472e-01,
        9.07356273e-01,  1.81582650e+00, -1.83048330e+00,  2.69011332e-01,
       -7.78775477e-01, -7.07245583e-01, -2.20766216e+00,  8.01053913e-01,
       -2.85271061e-01, -4.30500128e-01, -1.02798532e+00, -2.14394495e-01,
       -6.00414865e-01,  1.69886258e+00,  1.18870726e+00,  1.89418201e+00,
        6.63537416e-01, -6.57356993e-01,  5.84888588e-01, -4.69303164e-02,
       -1.51263440e+00,  3.28483996e-01,  3.71085271e-01, -1.98180074e+00,
        5.10608466e-01,  9.93623372e-01,  3.63206695e-01,  1.76026189e+00,
        4.16945609e-01,  4.60340010e-01, -3.34587242e-01,  7.81247958e-02,
        6.29644065e-01, -1.44753168e+00,  1.59994018e+00,  2.49900805e-01,
       -7.92160927e-01, -1.58140809e+00, -1.17218129e+00,  4.46667409e-01,
       -1.57085977e+00, -3.77197012e-01,  7.37113075e-01, -7.10252211e-01,
        4.91564807e-02,  1.43777758e-01, -1.67989794e-01, -1.37372537e+00,
        2.74085666e-01, -3.91290631e-01,  1.25766313e-01, -6.19771474e-01,
       -1.18444109e+00, -3.60857491e-01, -3.02766486e-01,  2.80886548e-01,
        1.06098475e+00,  8.92720199e-01,  1.58706343e-01,  1.33925498e-01,
       -6.64677744e-01,  3.82117366e-02, -8.04497402e-01,  6.44809540e-02,
        8.19509160e-01,  1.54234085e-01,  1.86756394e-01,  1.05808859e+00,
       -3.76722507e-01, -5.82598720e-01,  9.21273057e-01, -1.18029043e+00,
        1.39716627e+00, -8.36505273e-01,  1.64259768e+00, -9.75679809e-01,
       -4.22414080e-01, -9.83327058e-01,  1.86354375e-01,  1.07548559e-01,
       -2.40821179e-01, -2.53233760e-01, -1.01050266e+00,  3.48880683e-02,
        1.22715619e+00,  6.42995977e-01,  5.75838008e-01, -8.04923277e-01,
       -7.89235738e-01,  2.49159301e+00,  7.19138101e-01, -1.57233569e-01,
        2.18507490e-01,  7.60602976e-01,  5.23913632e-01, -1.48990989e-01,
        2.69689887e+00, -6.70279370e-01,  9.11341939e-01,  4.84782593e-02,
       -1.05395220e+00, -1.03419622e+00, -6.93923086e-01, -1.53008734e+00,
       -6.93291981e-01,  1.28846632e+00,  8.68337855e-01,  7.47440407e-01,
       -3.71652958e-01, -1.04449747e-01,  1.03724839e+00, -3.10609780e-01])
# 注意:添加图例是在绘制图形之后
设置中文正常显示
plt.rcParams['font.family'] = ['FangSong']  # 正常显示中文
plt.rcParams['axes.unicode_minus'] = False  # 正常显示负号
画图中的各种属性,标题,坐标轴等
data = np.arange(0,1,0.01)
plt.title('这是标题')
plt.xlabel('x轴')
plt.ylabel('y轴')
plt.xlim(0,1)  # 指定x轴的范围
plt.ylim(0,1)  # 指定Y轴的范围
plt.xticks([0,0.2,0.4,0.6,0.8,1])  # 设置x轴的刻度
plt.yticks([0,0.2,0.4,0.6,0.8,1])

plt.tick_params(labelsize=12)
plt.plot(data, data**2)
plt.plot(data, data**3)

plt.legend(['图例1','图例2'])
plt.show()
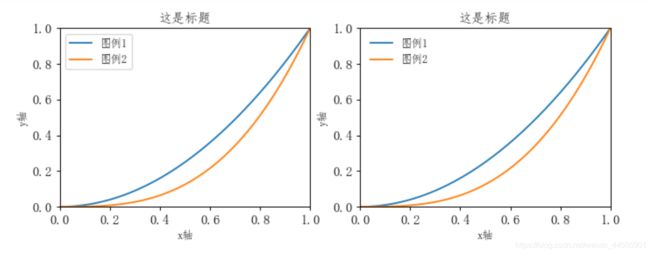
data = np.arange(0, np.pi*2,0.01)
fig1 = plt.figure(figsize=(9,7), dpi=90)
ax1 = fig1.add_subplot(1,2,1)
plt.title('这是标题')
plt.xlabel('x轴')
plt.ylabel('y轴')
plt.xlim(0,1)  # 指定x轴的范围
plt.ylim(0,1)  # 指定Y轴的范围
plt.xticks([0,0.2,0.4,0.6,0.8,1])  # 设置x轴的刻度
plt.yticks([0,0.2,0.4,0.6,0.8,1])

plt.tick_params(labelsize=12)
plt.plot(data, data**2)
plt.plot(data, data**3)

plt.legend(['图例1','图例2'])

ax2 = fig1.add_subplot(1,2,2)
plt.title('这是标题')
plt.xlabel('x轴')
plt.ylabel('y轴')
plt.xlim(0,1)  # 指定x轴的范围
plt.ylim(0,1)  # 指定Y轴的范围
plt.xticks([0,0.2,0.4,0.6,0.8,1])  # 设置x轴的刻度
plt.yticks([0,0.2,0.4,0.6,0.8,1])

plt.tick_params(labelsize=12)
plt.plot(data, data**2)
plt.plot(data, data**3)

plt.legend(['图例1','图例2'],loc=0, frameon = False)

plt.show()
图例 plt.legend()
图例位置 参数 loc
| 数字 | 位置 |
|---|---|
| 0 | best |
| 1 | upper right |
| 2 | upper left |
| 3 | lower left |
| 4 | lower right |
| 5 | right |
| 6 | center left |
| 7 | center right |
| 8 | lower center |
| 9 | upper center |
| 10 | center |
参数fontsize
设置图例文字大小
plt.legend(loc='best', frameon = False)
# 去掉图例边框,推荐使用

plt.legend(loc='best', edgecolor='blue')
# 图例边框颜色

plt.legend(loc='best', facecolor='blue')
# 设置图例背景颜色,如果没有边框,则设置无效
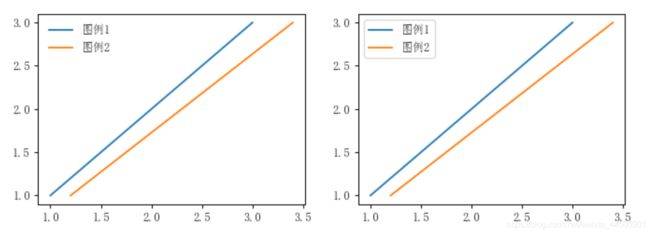
fig1 = plt.figure(figsize=(9,3), dpi=90)
ax1 = fig1.add_subplot(1,2,1)
plt.plot([1,2,3],[1,2,3])
plt.plot([1.2,2.3,3.4],[1,2,3])
plt.legend(['图例1','图例2'],loc='best',frameon = False)

ax2 = fig1.add_subplot(1,2,2)
plt.plot([1,2,3],[1,2,3])
plt.plot([1.2,2.3,3.4],[1,2,3])
plt.legend(['图例1','图例2'],loc='best')
plt.show()
fig1 = plt.figure(figsize=(9,3), dpi=90)
ax1 = fig1.add_subplot(1,2,1)
plt.plot([1,2,3],[1,2,3])
plt.plot([1.2,2.3,3.4],[1,2,3])
plt.legend(['图例1','图例2'],loc='best',edgecolor='blue')

ax2 = fig1.add_subplot(1,2,2)
plt.plot([1,2,3],[1,2,3])
plt.plot([1.2,2.3,3.4],[1,2,3])
plt.legend(['图例1','图例2'],loc='best',facecolor='blue')
plt.show()
动态参数 rc
matplotlib配置了配色方案和默认设置,有两种方式可以设置参数
1.全局参数定制
2.rc的设置方法
# 查看matplotlib的rc参数
import matplotlib
print(matplotlib.rc_params())
_internal.classic_mode: False
agg.path.chunksize: 0
animation.avconv_args: []
animation.avconv_path: avconv
animation.bitrate: -1
animation.codec: h264
animation.convert_args: []
animation.convert_path: convert
animation.embed_limit: 20.0
animation.ffmpeg_args: []
animation.ffmpeg_path: ffmpeg
animation.frame_format: png
animation.html: none
animation.html_args: []
animation.writer: ffmpeg
axes.autolimit_mode: data
axes.axisbelow: line
axes.edgecolor: black
axes.facecolor: white
axes.formatter.limits: [-5, 6]
axes.formatter.min_exponent: 0
axes.formatter.offset_threshold: 4
axes.formatter.use_locale: False
axes.formatter.use_mathtext: False
axes.formatter.useoffset: True
axes.grid: False
axes.grid.axis: both
axes.grid.which: major
axes.labelcolor: black
axes.labelpad: 4.0
axes.labelsize: medium
axes.labelweight: normal
axes.linewidth: 0.8
axes.prop_cycle: cycler('color', ['#1f77b4', '#ff7f0e', '#2ca02c', '#d62728', '#9467bd', '#8c564b', '#e377c2', '#7f7f7f', '#bcbd22', '#17becf'])
axes.spines.bottom: True
axes.spines.left: True
axes.spines.right: True
axes.spines.top: True
axes.titlecolor: auto
axes.titlelocation: center
axes.titlepad: 6.0
axes.titlesize: large
axes.titleweight: normal
axes.titley: None
axes.unicode_minus: True
axes.xmargin: 0.05
axes.ymargin: 0.05
axes3d.grid: True
backend: module://ipykernel.pylab.backend_inline
backend_fallback: True
boxplot.bootstrap: None
boxplot.boxprops.color: black
boxplot.boxprops.linestyle: -
boxplot.boxprops.linewidth: 1.0
boxplot.capprops.color: black
boxplot.capprops.linestyle: -
boxplot.capprops.linewidth: 1.0
boxplot.flierprops.color: black
boxplot.flierprops.linestyle: none
boxplot.flierprops.linewidth: 1.0
boxplot.flierprops.marker: o
boxplot.flierprops.markeredgecolor: black
boxplot.flierprops.markeredgewidth: 1.0
boxplot.flierprops.markerfacecolor: none
boxplot.flierprops.markersize: 6.0
boxplot.meanline: False
boxplot.meanprops.color: C2
boxplot.meanprops.linestyle: --
boxplot.meanprops.linewidth: 1.0
boxplot.meanprops.marker: ^
boxplot.meanprops.markeredgecolor: C2
boxplot.meanprops.markerfacecolor: C2
boxplot.meanprops.markersize: 6.0
boxplot.medianprops.color: C1
boxplot.medianprops.linestyle: -
boxplot.medianprops.linewidth: 1.0
boxplot.notch: False
boxplot.patchartist: False
boxplot.showbox: True
boxplot.showcaps: True
boxplot.showfliers: True
boxplot.showmeans: False
boxplot.vertical: True
boxplot.whiskerprops.color: black
boxplot.whiskerprops.linestyle: -
boxplot.whiskerprops.linewidth: 1.0
boxplot.whiskers: 1.5
contour.corner_mask: True
contour.linewidth: None
contour.negative_linestyle: dashed
datapath: F:\python3.6\an\lib\site-packages\matplotlib\mpl-data
date.autoformatter.day: %Y-%m-%d
date.autoformatter.hour: %m-%d %H
date.autoformatter.microsecond: %M:%S.%f
date.autoformatter.minute: %d %H:%M
date.autoformatter.month: %Y-%m
date.autoformatter.second: %H:%M:%S
date.autoformatter.year: %Y
date.epoch: 1970-01-01T00:00:00
docstring.hardcopy: False
errorbar.capsize: 0.0
figure.autolayout: False
figure.constrained_layout.h_pad: 0.04167
figure.constrained_layout.hspace: 0.02
figure.constrained_layout.use: False
figure.constrained_layout.w_pad: 0.04167
figure.constrained_layout.wspace: 0.02
figure.dpi: 100.0
figure.edgecolor: white
figure.facecolor: white
figure.figsize: [6.4, 4.8]
figure.frameon: True
figure.max_open_warning: 20
figure.raise_window: True
figure.subplot.bottom: 0.11
figure.subplot.hspace: 0.2
figure.subplot.left: 0.125
figure.subplot.right: 0.9
figure.subplot.top: 0.88
figure.subplot.wspace: 0.2
figure.titlesize: large
figure.titleweight: normal
font.cursive: ['Apple Chancery', 'Textile', 'Zapf Chancery', 'Sand', 'Script MT', 'Felipa', 'cursive']
font.family: ['sans-serif']
font.fantasy: ['Comic Neue', 'Comic Sans MS', 'Chicago', 'Charcoal', 'ImpactWestern', 'Humor Sans', 'xkcd', 'fantasy']
font.monospace: ['DejaVu Sans Mono', 'Bitstream Vera Sans Mono', 'Computer Modern Typewriter', 'Andale Mono', 'Nimbus Mono L', 'Courier New', 'Courier', 'Fixed', 'Terminal', 'monospace']
font.sans-serif: ['DejaVu Sans', 'Bitstream Vera Sans', 'Computer Modern Sans Serif', 'Lucida Grande', 'Verdana', 'Geneva', 'Lucid', 'Arial', 'Helvetica', 'Avant Garde', 'sans-serif']
font.serif: ['DejaVu Serif', 'Bitstream Vera Serif', 'Computer Modern Roman', 'New Century Schoolbook', 'Century Schoolbook L', 'Utopia', 'ITC Bookman', 'Bookman', 'Nimbus Roman No9 L', 'Times New Roman', 'Times', 'Palatino', 'Charter', 'serif']
font.size: 10.0
font.stretch: normal
font.style: normal
font.variant: normal
font.weight: normal
grid.alpha: 1.0
grid.color: #b0b0b0
grid.linestyle: -
grid.linewidth: 0.8
hatch.color: black
hatch.linewidth: 1.0
hist.bins: 10
image.aspect: equal
image.cmap: viridis
image.composite_image: True
image.interpolation: antialiased
image.lut: 256
image.origin: upper
image.resample: True
interactive: False
keymap.all_axes: ['a']
keymap.back: ['left', 'c', 'backspace', 'MouseButton.BACK']
keymap.copy: ['ctrl+c', 'cmd+c']
keymap.forward: ['right', 'v', 'MouseButton.FORWARD']
keymap.fullscreen: ['f', 'ctrl+f']
keymap.grid: ['g']
keymap.grid_minor: ['G']
keymap.help: ['f1']
keymap.home: ['h', 'r', 'home']
keymap.pan: ['p']
keymap.quit: ['ctrl+w', 'cmd+w', 'q']
keymap.quit_all: []
keymap.save: ['s', 'ctrl+s']
keymap.xscale: ['k', 'L']
keymap.yscale: ['l']
keymap.zoom: ['o']
legend.borderaxespad: 0.5
legend.borderpad: 0.4
legend.columnspacing: 2.0
legend.edgecolor: 0.8
legend.facecolor: inherit
legend.fancybox: True
legend.fontsize: medium
legend.framealpha: 0.8
legend.frameon: True
legend.handleheight: 0.7
legend.handlelength: 2.0
legend.handletextpad: 0.8
legend.labelspacing: 0.5
legend.loc: best
legend.markerscale: 1.0
legend.numpoints: 1
legend.scatterpoints: 1
legend.shadow: False
legend.title_fontsize: None
lines.antialiased: True
lines.color: C0
lines.dash_capstyle: butt
lines.dash_joinstyle: round
lines.dashdot_pattern: [6.4, 1.6, 1.0, 1.6]
lines.dashed_pattern: [3.7, 1.6]
lines.dotted_pattern: [1.0, 1.65]
lines.linestyle: -
lines.linewidth: 1.5
lines.marker: None
lines.markeredgecolor: auto
lines.markeredgewidth: 1.0
lines.markerfacecolor: auto
lines.markersize: 6.0
lines.scale_dashes: True
lines.solid_capstyle: projecting
lines.solid_joinstyle: round
markers.fillstyle: full
mathtext.bf: sans:bold
mathtext.cal: cursive
mathtext.default: it
mathtext.fallback: cm
mathtext.fallback_to_cm: None
mathtext.fontset: dejavusans
mathtext.it: sans:italic
mathtext.rm: sans
mathtext.sf: sans
mathtext.tt: monospace
mpl_toolkits.legacy_colorbar: True
patch.antialiased: True
patch.edgecolor: black
patch.facecolor: C0
patch.force_edgecolor: False
patch.linewidth: 1.0
path.effects: []
path.simplify: True
path.simplify_threshold: 0.111111111111
path.sketch: None
path.snap: True
pcolor.shading: flat
pdf.compression: 6
pdf.fonttype: 3
pdf.inheritcolor: False
pdf.use14corefonts: False
pgf.preamble:
pgf.rcfonts: True
pgf.texsystem: xelatex
polaraxes.grid: True
ps.distiller.res: 6000
ps.fonttype: 3
ps.papersize: letter
ps.useafm: False
ps.usedistiller: None
savefig.bbox: None
savefig.directory: ~
savefig.dpi: figure
savefig.edgecolor: auto
savefig.facecolor: auto
savefig.format: png
savefig.jpeg_quality: 95
savefig.orientation: portrait
savefig.pad_inches: 0.1
savefig.transparent: False
scatter.edgecolors: face
scatter.marker: o
svg.fonttype: path
svg.hashsalt: None
svg.image_inline: True
text.antialiased: True
text.color: black
text.hinting: force_autohint
text.hinting_factor: 8
text.kerning_factor: 0
text.latex.preamble:
text.latex.preview: False
text.usetex: False
timezone: UTC
tk.window_focus: False
toolbar: toolbar2
webagg.address: 127.0.0.1
webagg.open_in_browser: True
webagg.port: 8988
webagg.port_retries: 50
xaxis.labellocation: center
xtick.alignment: center
xtick.bottom: True
xtick.color: black
xtick.direction: out
xtick.labelbottom: True
xtick.labelsize: medium
xtick.labeltop: False
xtick.major.bottom: True
xtick.major.pad: 3.5
xtick.major.size: 3.5
xtick.major.top: True
xtick.major.width: 0.8
xtick.minor.bottom: True
xtick.minor.pad: 3.4
xtick.minor.size: 2.0
xtick.minor.top: True
xtick.minor.visible: False
xtick.minor.width: 0.6
xtick.top: False
yaxis.labellocation: center
ytick.alignment: center_baseline
ytick.color: black
ytick.direction: out
ytick.labelleft: True
ytick.labelright: False
ytick.labelsize: medium
ytick.left: True
ytick.major.left: True
ytick.major.pad: 3.5
ytick.major.right: True
ytick.major.size: 3.5
ytick.major.width: 0.8
ytick.minor.left: True
ytick.minor.pad: 3.4
ytick.minor.right: True
ytick.minor.size: 2.0
ytick.minor.visible: False
ytick.minor.width: 0.6
ytick.right: False
matplotlib的全局参数可以通过编辑其配置文件设置
import matplotlib
print(matplotlib.matplotlib_fname())

# 显示当前用户的配置文件目录
# 修改其中的 matplotlibrc 文件,即可修改配置参数
F:\python3.6\an\lib\site-packages\matplotlib\mpl-data\matplotlibrc
rc参数设置
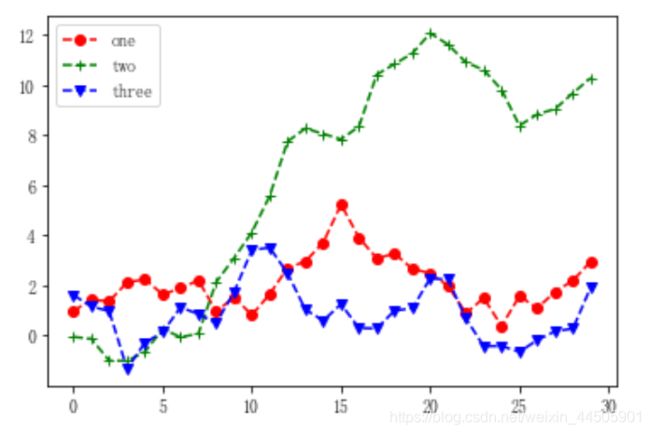
fig = plt.figure()
ax=fig.add_subplot(1,1,1)
ax.plot(np.random.randn(30).cumsum(), color='r', linestyle='dashed', marker='o', label='one')
ax.plot(np.random.randn(30).cumsum(), color='g', linestyle='dashed', marker='+', label='two')
ax.plot(np.random.randn(30).cumsum(), color='b', linestyle='dashed', marker='v', label='three')
ax.legend(loc='best')
fig = plt.figure()
ax=fig.add_subplot(1,1,1)
ax.plot(np.random.randn(30).cumsum(), color='r', linestyle='dashed', marker='o', label='one')
ax.plot(np.random.randn(30).cumsum(), color='g', linestyle='dashed', marker='+', label='two')
ax.plot(np.random.randn(30).cumsum(), color='b', linestyle='dashed', marker='v', label='three')

ax.set_xticks([0,5,10,15,20,25,30,35])  # 设置刻度值
ax.legend(loc='best')
3 设置x轴的刻度标签旋转 ax.set_xticklabels()
fig = plt.figure()
ax=fig.add_subplot(1,1,1)
ax.plot(np.random.randn(30).cumsum(), color='r', linestyle='dashed', marker='o', label='one')
ax.plot(np.random.randn(30).cumsum(), color='g', linestyle='dashed', marker='+', label='two')
ax.plot(np.random.randn(30).cumsum(), color='b', linestyle='dashed', marker='v', label='three')

ax.set_xticklabels(['aaaa','bbbb','cccc','ddddd','wwwww','eeeee'], rotation=30, fontsize='large')
ax.legend(loc='best')
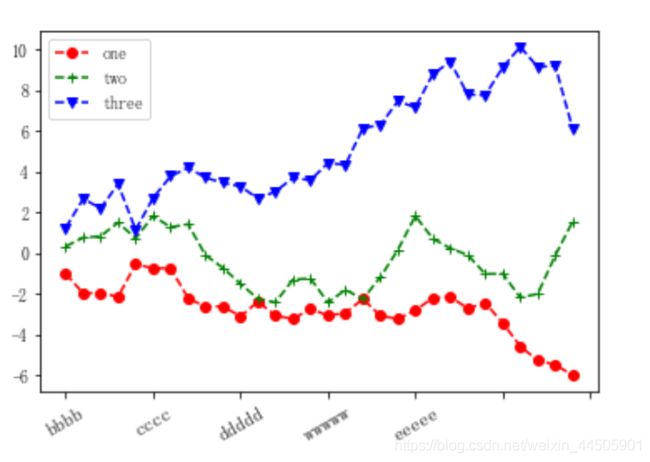
ax.set_xticklabels([‘aaaa’,‘bbbb’,‘cccc’,‘ddddd’,‘wwwww’,‘eeeee’], rotation=30, fontsize=‘large’)
rotation=30 表示旋转角度
fontsize=‘large’ 设置字号
4 添加文本注解
data = [25,30,32,34,34,23]
label = ['西宁','兰州','北京','上海','广州','拉萨']

plt.xticks(range(len(data)),label)
plt.xlabel('城市')
plt.ylabel('温度')
plt.title('六城市8月份日均最高气温')
plt.bar(range(len(data)),data)
for x,y in zip(range(len(data)),data):
    plt.text(x,y,y,ha='center',va='bottom')
plt.show()
折线图 plot()
color常用颜色缩写
6.1 简单的折线图绘制
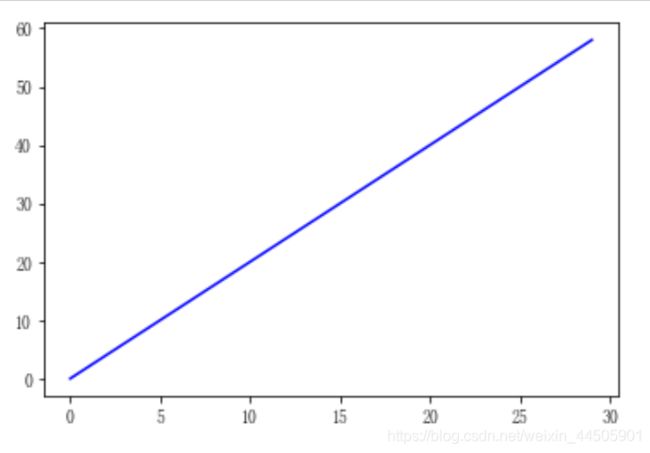
x1 = np.arange(0,30)
plt.plot(x1,x1*2, 'b') # b是蓝色
plt.show()
6.2 带点的折线图
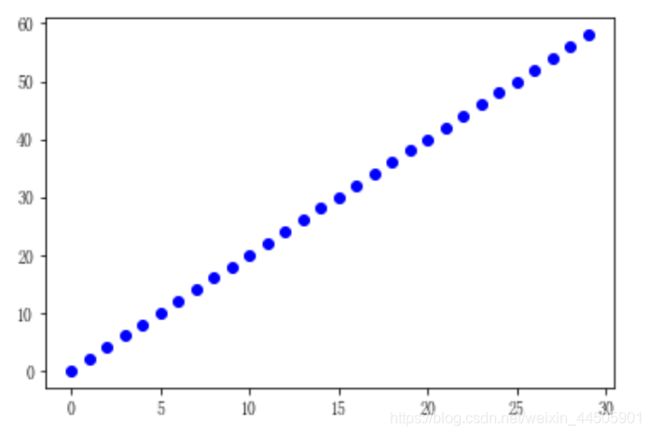
x1 = np.arange(0,30)
plt.plot(x1,x1*2, 'o') # b是蓝色
plt.show()
x1 = np.arange(0,30)
plt.plot(x1,x1*2, 'ro')
plt.show()
x1 = np.arange(0,30)
plt.plot(x1,x1*2, 'bo') # b是蓝色
plt.show()
散点图
matplotlib.pyplot.scatter(x,y, s=None, c=None, marker=None, alpha=None)
fig,ax = plt.subplots()
plt.rcParams['font.family'] = ['SimHei']
plt.rcParams['axes.unicode_minus'] = False
x1 = np.arange(1,30)
y1 = np.sin(x1)
ax1 = plt.subplot(1,1,1)
plt.title('散点图')
plt.xlabel('x')
plt.ylabel('y')
ax1.scatter(x1,y1,c='r',s=100,linewidths=x1,marker='o')
# 注意marker要为o,0,d等这些封闭图形时 linewidths才有效果

plt.legend('x1')
plt.show()
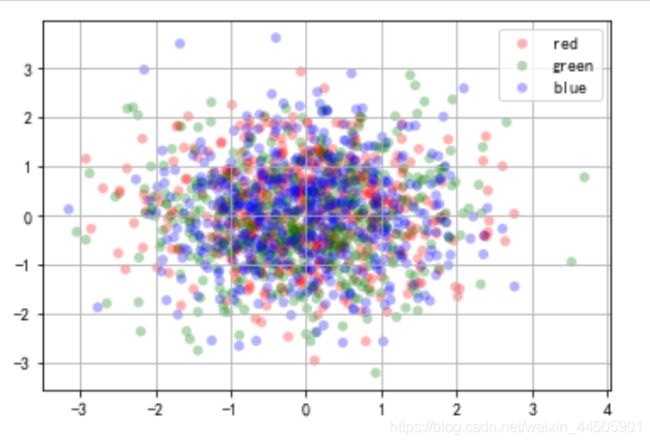
fig,ax = plt.subplots()
plt.rcParams['font.family'] = ['SimHei']
plt.rcParams['axes.unicode_minus'] = False
for color in ['red','green','blue']:
    n=500
    x,y=np.random.randn(2,n)


    ax.scatter(x,y,c=color,label=color,alpha=0.3,edgecolors='none')


plt.legend()
plt.grid(True)
plt.show()
8 直方图
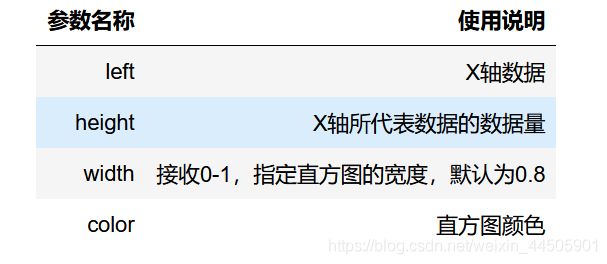
matplotlib.pyplot.bar(left, height, width=0.8, bottom=None,hold=None, data=None)
import pandas as pd
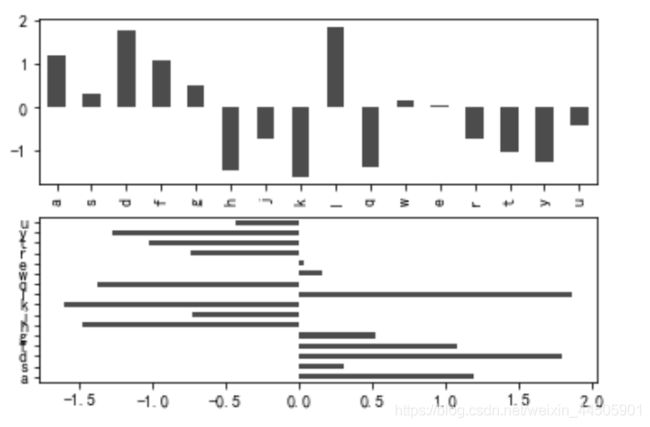
fig,axes = plt.subplots(2,1)
data = pd.Series(np.random.randn(16), index=list('asdfghjklqwertyu'))
data.plot.bar(ax=axes[0], color='k', alpha=0.7)
data.plot.barh(ax=axes[1], color='k', alpha=0.7)
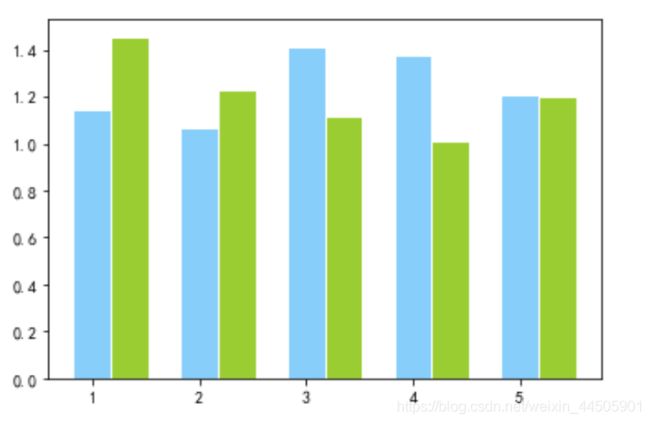
fig,ax = plt.subplots()
x=np.arange(1,6)
Y1 = np.random.uniform(1.5,1.0,5)
Y2 = np.random.uniform(1.5,1.0,5)
plt.bar(x,Y1,width=0.35,facecolor='lightskyblue',edgecolor='white')
plt.bar(x+0.35,Y2,width=0.35,facecolor='yellowgreen',edgecolor='white')
# 柱形图填充的颜色 facecolor
# 图形边缘颜色 edgecolor

plt.show()
fig,ax = plt.subplots()
x=np.arange(1,6)
Y1 = np.random.uniform(1.5,1.0,5)
Y2 = np.random.uniform(1.5,1.0,5)
plt.bar(x,Y1,width=0.35,facecolor='lightskyblue')
plt.bar(x+0.35,Y2,width=0.35,facecolor='yellowgreen')
plt.show()
fig,ax = plt.subplots()
x=np.arange(1,6)
Y1 = np.random.uniform(1.5,1.0,5)
Y2 = np.random.uniform(1.5,1.0,5)
plt.bar(x,Y1,width=0.35,facecolor='g')
plt.bar(x+0.35,Y2,width=0.35,facecolor='b')
plt.show()
饼图
plt.figure(figsize=(6,6))
ax= plt.axes([0.1,0.1,0.8,0.8])
labels = ['sparings','summer','autumn','winter']
x=[15,30,45,10]
expode = (0.05,0.05,0.05,0.05)
# 控制饼图分离距离,默认不分离

plt.pie(x,labels=labels, explode=expode, startangle=60, autopct='% 1.1f% %')
# autopct在图中显示比例值,注意值的格式
plt.title('标题')
plt.tick_params(labelsize=12)
plt.show()
10 箱线图
np.random.seed(2)
df = pd.DataFrame(np.random.rand(5,4),columns=['A','B','C','D'])
df.boxplot()
plt.show()
