多项式回归--过拟合和欠拟合 学习曲线
文章目录
- 一、过拟合与欠拟合
-
- 1、理解:
- 2、例子
- 3、总结:
- 二、为什么要区分测试数据集和训练数据集
-
- 1.原因:
- 2 例子:
- 3、模型复杂度曲线
- 三、学习曲线
-
- 1、代码实例:
-
- 1、对比
- 四、 总结
一、过拟合与欠拟合
1、理解:
	对于多项式回归中的过拟合和欠拟合,我自己的理解是:
	过拟合:为了拟合更多数据,这条多项式回归曲线往往变得太多复杂,不是我们想要的曲线
	欠拟合:比如一个二维多项式用简单线性回归来拟合,这条曲线又往往太多简单
	见下面例子:
2、例子
from sklearn.pipeline import Pipeline
from sklearn.preprocessing import StandardScaler
import numpy as np
from sklearn.preprocessing import PolynomialFeatures
import matplotlib.pyplot as plt
from sklearn.linear_model import LinearRegression
def pipline(degree):
    return Pipeline([
        ("poly",PolynomialFeatures(degree=degree)),
        ("sca_std",StandardScaler()),
        ("reg",LinearRegression())
])
degree=2
x=np.random.uniform(-3,3,size=100)
X=x.reshape(-1,1)
y=0.5*x**2+x+2+np.random.normal(0,1,size=100)
pip_reg=pipline(degree=2)
pip_reg.fit(X,y)
y_predict=pip_reg.predict(X)
plt.scatter(x,y)
plt.plot(np.sort(x),y_predict[np.argsort(x)],color='r')
plt.show()
from sklearn.metrics import mean_squared_error
mean_squared_error(y,y_predict)
pip_reg10=pipline(degree=10)
pip_reg10.fit(X,y)
y_predict10=pip_reg10.predict(X)
plt.scatter(x,y)
plt.plot(np.sort(x),y_predict10[np.argsort(x)],color='r')
plt.show()
mse=mean_squared_error(y,y_predict10)
mse
pip_reg100=pipline(degree=100)
pip_reg100.fit(X,y)
y_predict100=pip_reg10.predict(X)
plt.scatter(x,y)
plt.plot(np.sort(x),y_predict100[np.argsort(x)],color='r')   #但其实这条曲线并非x对应y的真正曲线
#因为x是随机取值,部分x点可能没有值,而有的x可能有两个值
plt.show()
mse=mean_squared_error(y,y_predict100)
mse
x1=np.linspace(-3,3,100).reshape(100,1)
y1=pip_reg100.predict(x1)
plt.scatter(x,y)
plt.plot(x1[:,0],y1,color='r')
plt.axis([-3,3,-1,10])
plt.show()
3、总结:
通过上述例子,我们也可以看出来,当degree越大时,虽然mse均差变小了,但是却出现了过拟合的现象,这是由于degree太大,维度太高导致,显然,这条曲线太多复杂,并不是我们想要的。
二、为什么要区分测试数据集和训练数据集
1.原因:
模型是通过训练数据集训练出来的,这个模型可能拟合训练数据集拟合的很好,但是对于测试数据集,它却不能很好的进行预测,这就是模型的泛化能力弱
我们寻找一个模型,更多的是要把它运用在现实中,所以应该寻找泛化能力强的模型。
即训练数据集是用来训练模型的,测试数据集可以用来评判模型的好坏。
以免出现过拟合的线性,如果只有训练数据集,表面上可能拟合数据很好
但是它的泛化能力很弱,没有测试数据集的话,我们就会不自知。
2 例子:
from sklearn.model_selection import train_test_split
from sklearn.linear_model import LinearRegression
x=np.random.uniform(-3,3,size=100)
X=x.reshape(-1,1)
y=0.5*x**2+x+2+np.random.normal(0,1,size=100)
x_train,x_test,y_train,y_test=train_test_split(X,y)
#线性
lin_reg=LinearRegression()
lin_reg.fit(x_train,y_train)
y_predict=lin_reg.predict(x_test)
mean_squared_error(y_test,y_predict)
3.9828289996979125
#degree=2
poly2_reg=pipline(degree=2)
poly2_reg.fit(x_train,y_train)
y2_predict=poly2_reg.predict(x_test)
mean_squared_error(y_test,y2_predict)
1.2308554208626004
degree=10
poly10_reg=pipline(degree=10)
poly10_reg.fit(x_train,y_train)
y10_predict=poly10_reg.predict(x_test)
mean_squared_error(y_test,y10_predict)
10.86425882753361
degree=100
poly100_reg=pipline(degree=100)
poly100_reg.fit(x_train,y_train)
y100_predict=poly100_reg.predict(x_test)
mean_squared_error(y_test,y100_predict)
3.6268609789944914e+30
3、模型复杂度曲线
			我们可以看出来,当模型复杂变大时,虽然对训练集的拟合程度变好
			但是对测试集的测试误差却变的越来越大,这证明我们拟合出来的模型效果并不好。
			并且要注意到模型复杂度对训练集和测试集的模型准确率是不一样的。
			我们要寻找的是对测试集模型准确率最高的拟合模型。
三、学习曲线
学习曲线就是看随着训练数据集的增大,训练出来的模型的表现能力(不仅包含对训练数据的表现能力,还包含对测试数据的表现能力)

1、代码实例:
from sklearn.model_selection import train_test_split
from sklearn.linear_model import LinearRegression
from sklearn.preprocessing import PolynomialFeatures
import numpy as np
from sklearn.pipeline import Pipeline
from sklearn.preprocessing import StandardScaler
from sklearn.preprocessing import PolynomialFeatures
from sklearn.metrics import mean_squared_error
import matplotlib.pyplot as plt
x=np.random.uniform(-3.0,3.0,size=100)
X=x.reshape(-1,1)
y=0.5*x**2+x+2+np.random.normal(0,1,size=100)
x_train,x_test,y_train,y_test=train_test_split(X,y,random_state=10)
pip_line=Pipeline([
    ("poly",PolynomialFeatures(degree=2)),
    ("sca_std",StandardScaler()),
    ("reg",LinearRegression())
])
#定义绘制学习曲线函数
def plot_learning_curve(algo,x_train,x_test,y_train,y_test):
    #保存通过不同训练集训练出来的模型的均值方差
    train_score=[]
    test_score=[]
    #训练数据集依次从1添加到len(x_train)
    for i in range(1,len(x_train)+1):
        algo.fit(x_train[:i],y_train[:i])
        y_train_predict=algo.predict(x_train[:i])
        y_test_predict=algo.predict(x_test)
        train_score.append(mean_squared_error(y_train[:i],y_train_predict))
        test_score.append(mean_squared_error(y_test,y_test_predict))
    #绘制对照不同的训练数据集个数其对应的均值方差,这个绘制的是rmse,因为mse可能会太大
    plt.plot([i for i in range(1,len(x_train)+1)],np.sqrt(train_score),label="train")
    plt.plot([i for i in range(1,len(x_train)+1)],np.sqrt(test_score),label="test")
    plt.legend()
    #限定范围,均值方根误差限定在0-4即可,不可能小于0,大于4可以理解为误差太大,没有意义
    plt.axis([1,len(x_train)+1,0,4])
    plt.show()


#定义管道
def pipline(degree):
    return Pipeline([
        ("poly",PolynomialFeatures(degree=degree)),
        ("sca_std",StandardScaler()),
        ("reg",LinearRegression())
])
#当假设数据呈现简单线性关系时
plot_learning_curve(LinearRegression(),x_train,x_test,y_train,y_test)
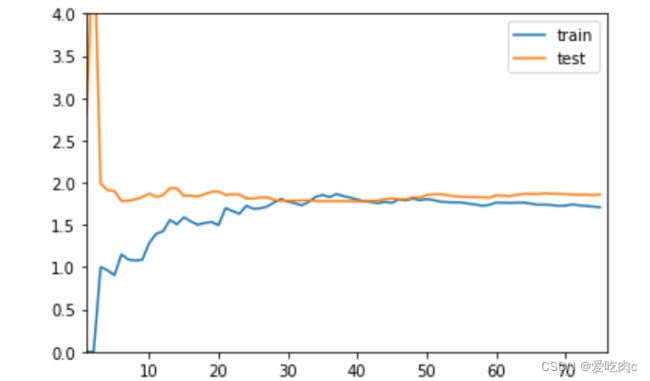
我们发现test测试数据集的误差随样本个数增大而增大之后趋于平稳
很好理解:当只有一个样本时,一定是完全拟合的。
train训练数据集随样本个数增大而减小,之后趋于平稳。
这也好理解:由 于测试数据集个数增大,相对而言他的泛化能力也会变强
当我们让degree=2的多项式回归时,
poly_reg2=pipline(degree=2)
plot_learning_curve(poly_reg2,x_train,x_test,y_train,y_test)
趋势与线性回归相同,
但是最后平稳的误差比线性要低
在degree=10的多项式回归中
poly_reg20=pipline(degree=10)
plot_learning_curve(poly_reg20,x_train,x_test,y_train,y_test)
对于训练数据集的拟合程度已经很好了
但是对于测试数据集拟合程度却不好。
它的误差与训练数据集的误差相比于前两个相差的有点多
这往往就被称为过拟合
1、对比
四、 总结
但只是区分训练数据集和测试数据集还是会有问题
虽然在训练数据集的基础上加上了测试数据集,会防止对训练数据集过拟合的现象,但是当我们通过训练数据集训练出来一个模型以后,
我们通过模型对测试数据集上的表现来调整超参数,比如knn中的N和p
多项式回归中的degree,但是我们知道测试数据集是已知的,如果我们仅仅通过测试数据集来调整超参数来评判模型的话,又会出现对测试数据集过拟合的现象。这是就需要验证数据集,见下一篇


