plt.contour()功用
import matplotlib.pyplot as plt
plt.contour([X, Y,] Z, [levels], ** kwargs)
或
matplotlib.pyplot.contour([X, Y,] Z, [levels], ** kwargs)
作用:绘制轮廓线,类于等高线 。
contour and contourf draw contour lines and filled contours, respectively.
参数:
X,Y :值Z的坐标。
X和Y必须都是2-D,且形状与Z相同,或者它们必须都是1-d,这样len(X)== M是Z中的列数,len(Y)== N是Z中的行数。
Z : 绘制轮廓的高度值。
levels: int或类数组,确定轮廓线/区域的数量和位置。
返回:
c : QuadContourSet
示例1
code
import numpy as np
import matplotlib.pyplot as plt
x = np.arange(1, 10)
y = x.reshape(-1, 1)
h = x * y

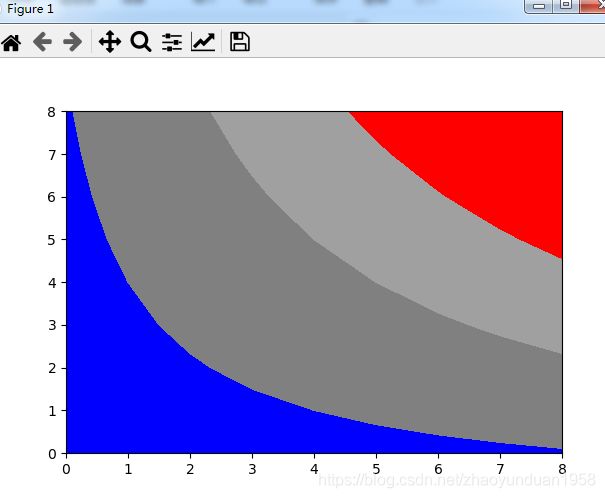
cs = plt.contourf(h, levels=[10, 30, 50],
    colors=['#808080', '#A0A0A0', '#C0C0C0'], extend='both')
cs.cmap.set_over('red')
cs.cmap.set_under('blue')
cs.changed()
output

参考:https://matplotlib.org/api/_as_gen/matplotlib.pyplot.contour.html#matplotlib.pyplot.contour
示例 2
code:
import numpy as np
import pandas as pd
import matplotlib.pyplot as plt

# 计算x,y坐标对应的高度值
def f(x, y):
 return (1-x/2+x**5+y**3) * np.exp(-x**2-y**2)

# 生成x,y的数据
n = 256
x = np.linspace(-3, 3, n)
y = np.linspace(-3, 3, n)

# 把x,y数据生成mesh网格状的数据,因为等高线的显示是在网格的基础上添加上高度值
X, Y = np.meshgrid(x, y)

# 填充等高线
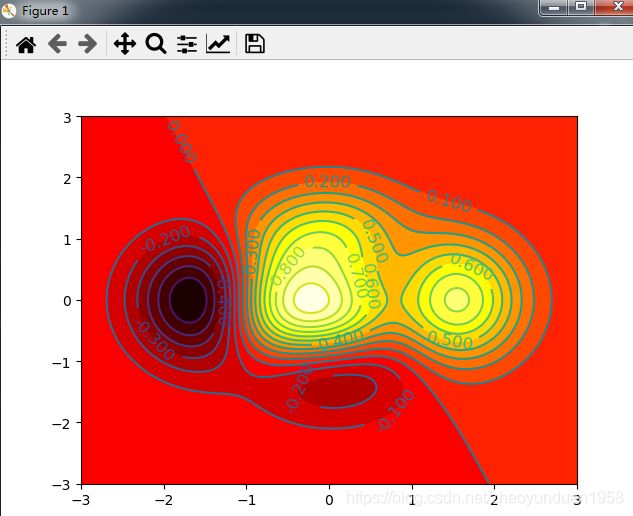
plt.contourf(X, Y, f(X, Y), 20, cmap=plt.cm.hot)
# 添加等高线
C = plt.contour(X, Y, f(X, Y), 20)
plt.clabel(C, inline=True, fontsize=12)
# 显示图表
plt.show()
output:

参考:https://www.jb51.net/article/130617.htm
示例3
code:
import numpy as np
import pandas as pd
import matplotlib.pyplot as plt
# 计算x,y坐标对应的高度值
def f(x,y):
#the height function
    return(1-x/2+x**5+y**3)*np.exp(-x**2-y**2)
# 生成x,y的数据
x = np.linspace(-4, 3, 500)
y = np.linspace(-4, 3, 500)
X, Y = np.meshgrid(x, y)# 把x,y数据生成mesh网格状的数据,因为等高线的显示是在网格的基础上添加上高度值
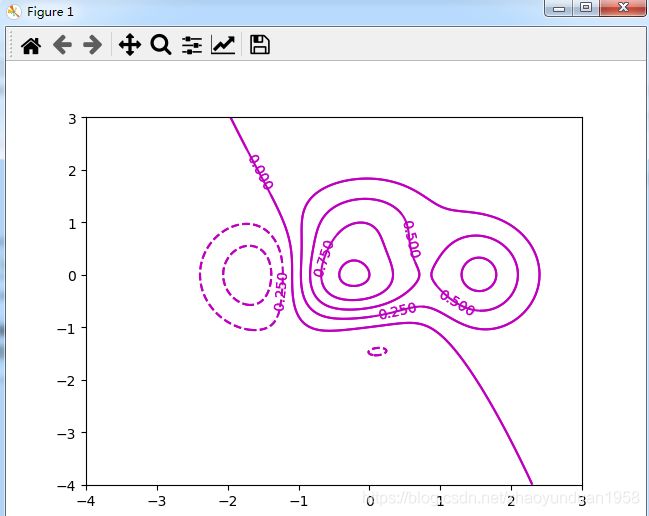
c = plt.contour(X, Y, f(X, Y),colors = 'm',linewidth=.5)
plt.clabel(c,inline=False,fontsize=10)#等高线标签
plt.show()
