吴恩达机器学习ex2:逻辑回归
吴恩达机器学习练习二:逻辑回归
1. 逻辑回归(logistic regression)

构建一个可以基于两次测试评分来评估录取可能性的分类模型。
知识点回顾:


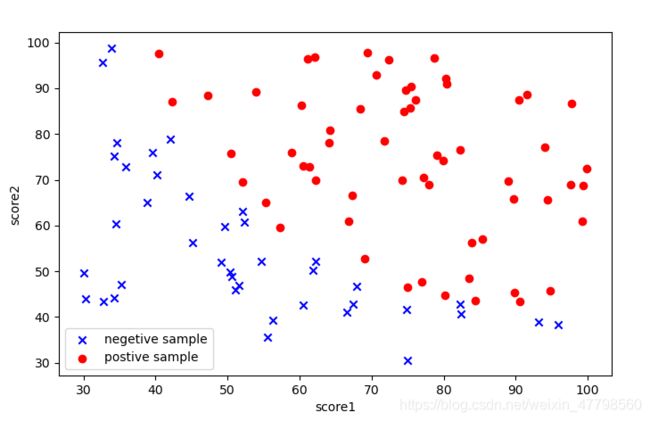
1.1 数据可视化
#coding=utf-8
import pandas as pd
import numpy as np
import matplotlib.pyplot as plt
plt.style.use('fivethirtyeight')  # 样式美化

# 读取数据,数据可视化
path  = 'D:\文档\ex2data1.txt'
data = pd.read_csv(path,header= None,names = ['score1','score2','admitted'])
print(data.head())
# print(data.describe())
第一种,有点过于复杂~
# x1,y1为negetive sample; x2,y2为 postive sample
x1= []
y1 = []
x2= []
y2 = []
for i in range(data.shape[0]):
    if data.iloc[i,2] == 0:
        x1.append(data.iloc[i,0])
        y1.append(data.iloc[i,1])
    else:
        x2.append(data.iloc[i,0])
        y2.append(data.iloc[i, 1])
plt.figure(figsize=(8,5),dpi = 50)
plt.scatter(x1,y1,color = 'blue',marker='x',label = 'negetive sample')
plt.scatter(x2,y2,color = 'red',marker='o',label = 'postive sample')
plt.legend(loc='lower left')
plt.xlabel('score1')
plt.ylabel('score2')
plt.show()
第二种,
positive = data[data.admitted.isin(['1'])]  # 1
negetive = data[data.admitted.isin(['0'])]  # 0
plt.figure(figsize=(8,5),dpi = 50)
plt.scatter(positive['score1'],positive['score2'],color = 'blue',marker='x',label = 'negetive sample')
plt.scatter(negetive['score1'],negetive['score2'],color = 'red',marker='o',label = 'postive sample')
plt.legend(loc='lower left')
plt.xlabel('score1')
plt.ylabel('score2')
plt.show()
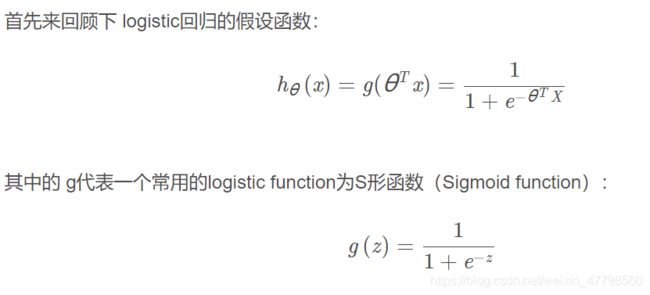
1.2 Sigmoid function
def sigmoid(z):
    return 1/(1+np.exp(-z))
xx = np.arange(-10,10,0.1)
plt.figure(figsize=(8,5),dpi = 50)
plt.plot(xx,sigmoid(xx))
plt.show()
1.3 Cost function(损失函数)
# 定义逻辑回归代价函数(cost function)
def costfunction(theta,x,y):
    first = (-y) * np.log(sigmoid(x @ theta))
    second = (1-y) * np.log(1- sigmoid(x @ theta))
    costf =np.mean(first - second)
    return costf
# 获取数据集数据
# add a ones column - this makes the matrix multiplication work out easier
if 'Ones' not in data.columns:
    data.insert(0, 'Ones', 1)
#ones = pd.DataFrame({'ones':np.ones(len(data))})
#data = pd.concat([ones,data],axis=1)
# # 合并数据方法二concat,根据列合并axis=1

# set X (training data) and y (target variable)
# .values是将Dataframe的表格型数据转换成数组,as_matrix已经被淘汰
x = data.iloc[:, :-1].values # Convert the frame to its Numpy-array representation.
y = data.iloc[:, -1].values # Return is NOT a Numpy-matrix, rather, a Numpy-array.
theta = np.zeros(x.shape[1])
# 检查数据集的维度
print(x.shape,y.shape,theta.shape)

# 计算代价函数
print(costfunction(theta,x,y))
接下来,我们需要一个函数来计算我们的训练数据、标签和一些参数thate的梯度。
1.4 Gradient(梯度下降)
# 定义梯度下降函数
def Gradient(theta,x,y):
    gradient =(x.T @ (sigmoid(x @ theta) - y))/len(x)
    return gradient

print(Gradient(theta,x,y))
1.5 Learning θ parameters(theta 参数)
注意,我们实际上没有在这个函数中执行梯度下降,我们仅仅在计算梯度。
# 高级优化算法计算成本和梯度参数
import scipy.optimize as opt
result = opt.fmin_tnc(func = costfunction, x0 =theta,fprime=Gradient,args = (x,y) )
print(result)
下面是第二种方法,结果是一样的
res = opt.minimize(fun = costfunction,x0=theta, args=(x, y), method='TNC',jac = Gradient )
print(res)
# 返回结果中res.x就是theta
     fun: 0.2034977015894744
     jac: array([9.11457705e-09, 9.59621025e-08, 4.84073722e-07])
 message: 'Local minimum reached (|pg| ~= 0)'
    nfev: 36
     nit: 17
  status: 0
 success: True
       x: array([-25.16131867,   0.20623159,   0.20147149])
print(costfunction(result[0],x,y))
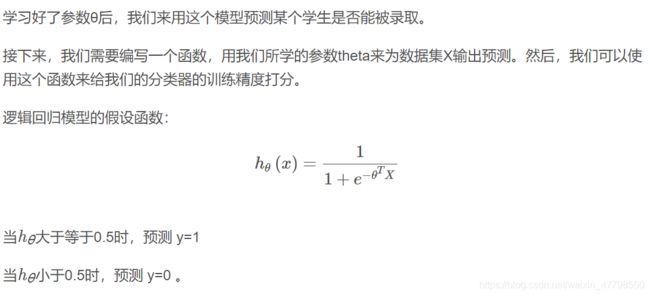
1.6 Evaluating logistic regression(评估logistic回归)
def predict(theta,x):
    probability = sigmoid(x @ theta)
    return [1 if a >= 0.5 else 0 for a in probability]  # return a list
    # 第二种写法
    #return (probability >= 0.5).astype(int)# 变量类型转换

final_theta = result[0]
prediction = predict(final_theta,x)
print(prediction)

# 方法一
acc_len = 0
for i in range(len(prediction)):
    if prediction[i] == y[i]:
        acc_len = acc_len+1
accuracy = acc_len/len(prediction)
print(accuracy)

# 方法二:zip()函数
correct = [1 if a==b else 0 for (a, b) in zip(prediction, y)]
accuracy = sum(correct) / len(x)
print(accuracy)
from sklearn.metrics import classification_report
print(classification_report(prediction, y))
             precision    recall  f1-score   support

          0       0.85      0.87      0.86        39
          1       0.92      0.90      0.91        61

avg / total       0.89      0.89      0.89       100
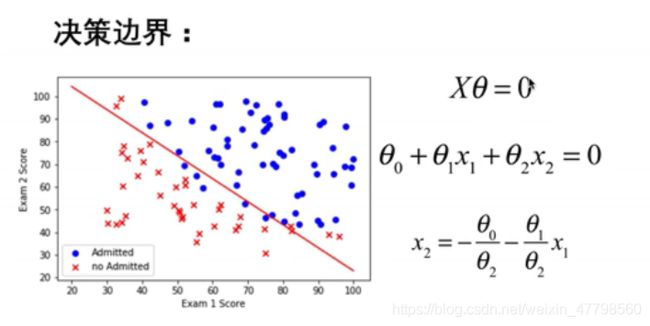
1.7 Decision boundary(决策边界)
x1 = np.arange(130,step = 0.1)
x2 = -(final_theta[0]+x1* final_theta[1]) / final_theta[2]

plt.figure(figsize=(8,5),dpi = 50)
plt.scatter(positive['score1'],positive['score2'],color = 'blue',marker='x',label = 'negetive sample')
plt.scatter(negetive['score1'],negetive['score2'],color = 'red',marker='o',label = 'postive sample')
plt.plot(x1,x2)
plt.xlabel('x1')
plt.ylabel('x2')
plt.legend()
plt.title('Decision Boundary')
plt.show()
2 Regularized logistic regression(正则化逻辑回归)
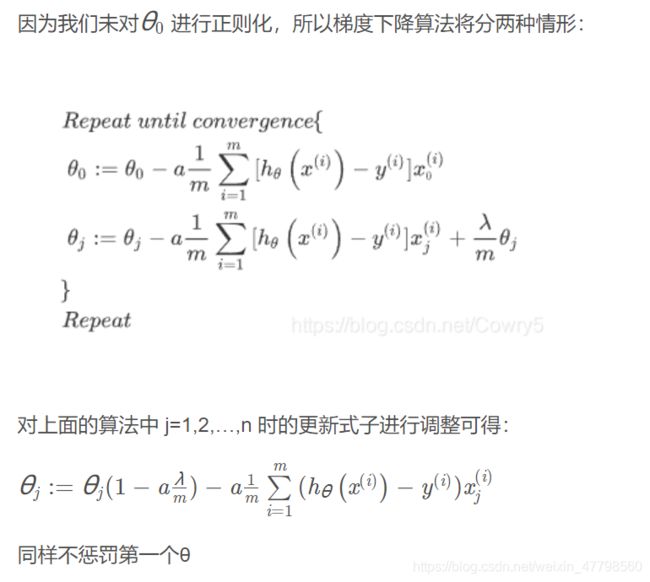
加入正则项提升逻辑回归算法。正则化是成本函数中的一个术语,它使算法更倾向于“更简单”的模型(在这种情况下,模型将更小的系数)。有助于减少过拟合,提高模型的泛化能力。
2.1 Visualizing the data (数据可视化)
plt.style.use('fivethirtyeight')  # 样式美化
path = 'D:\文档\ex2data2.txt'
data2 = pd.read_csv(path,header=None,names = ['Test1','Test2','Accepted'])
print(data2.head())
postive = data2[data2.Accepted.isin(['1'])]
negetive = data2[data2.Accepted.isin(['0'])]
print(postive)
plt.figure(figsize=(8,5),dpi = 50)
plt.scatter(postive['Test1'],postive['Test2'],label = 'postive',color = 'blue')
plt.scatter(negetive['Test1'],negetive['Test2'],label = 'negetive',color = 'red',marker= 'x')
plt.xlabel('Test1')
plt.ylabel('Test2')
plt.legend()
plt.show()
注意到其中的正负两类数据并没有线性的决策界限。因此直接用logistic回归在这个数据集上并不能表现良好,因为它只能用来寻找一个线性的决策边界。
2.2 Feature mapping(特征映射)
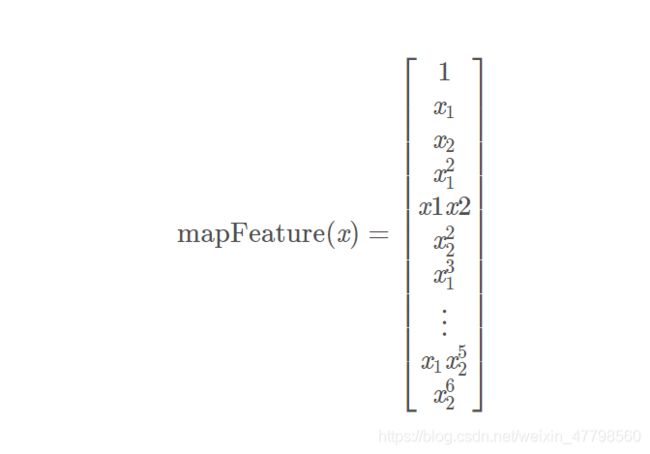
一个拟合数据的更好的方法是从每个数据点创建更多的特征。
我们将把这些特征映射到所有的x1和x2的多项式项上,直到第六次幂。
for i in 0..power
      for p in 0..i:
        output x1^(i-p) * x2^p```
# 定义特征缩放
def feature_mapping(power,x,y):
    data = {}
    for i in np.arange(power+1):
        for p in np.arange(i+1):
            data['f{}{}'.format(i-p,p)] = np.power(x,i-p) * np.power(y,p)
            data = pd.DataFrame(data)
    return data
#.values是dataframe类对象的一个属性,不是方法
x1 = data2['Test1'].values
y1 = data2['Test2'].values
data = feature_mapping(6,x1,y1)
#print(data)
print(data.shape)
print(data.head())
经过映射,我们将有两个特征的向量转化成了一个28维的向量。
2.3 Regularized Cost function(正则化损失函数)
# 定义sigmoid/logistic函数
def sigmoid(z):
    return 1/(1+np.exp(-z))
# 定义正则化损失函数
def regular_costf(x,y,theta,lam):
    first = - y * np.log(sigmoid(x @ theta))
    second = -(1-y) * np.log(1-sigmoid(x @ theta))
    third = theta[1:]
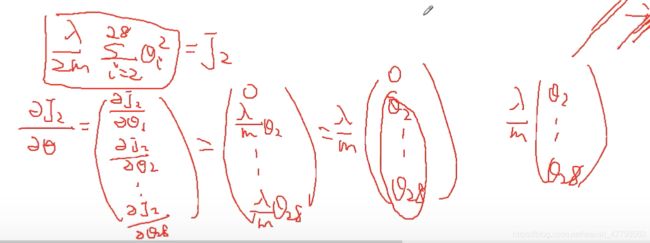
    return np.mean(first+second)+ (lam/(2*len(x)))* np.power(third,2).sum()

# 数据x,y,theta获取
x = data.values
y = data2['Accepted'].values
theta = np.zeros(x.shape[1])
print(regular_costf(x,y,theta,lam=1))
2.4 Regularized gradient(正则化梯度下降)
# 梯度下降算法
def Gradient(theta,x,y):
     gradient =(x.T @ (sigmoid(x @ theta) - y))/len(x)
     return gradient
# 正则化梯度下降算法
def regular_gradient(theta,lam,x,y):
    reg = (lam/len(x))*theta
    reg[0] = 0
    return Gradient(theta,x,y)+reg
print(regular_gradient(theta,1,x,y))
2.5 Learning parameters
# 优化算法minimize()
import scipy.optimize as opt
# result = opt.minimize(fun=regular_costf,x0=theta,args=(x,y,1),method='CG',jac=regular_gradient)
# print(result)
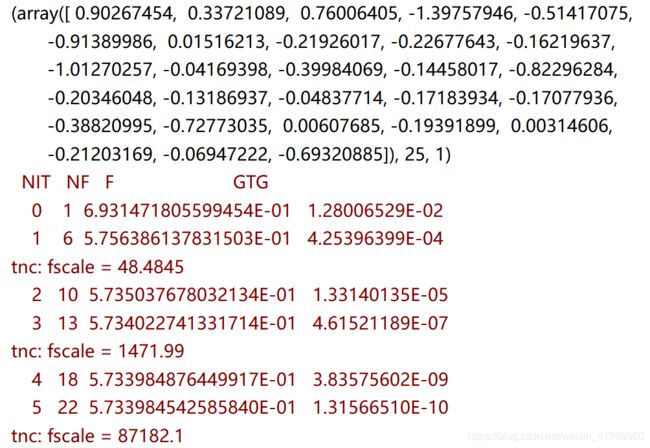
result2 = opt.fmin_tnc(func=regular_costf, x0=theta, fprime=regular_gradient, args=(x, y, 2))
print(result2)
我们还可以使用Python库scikit-learn来解决这个问题。
from sklearn import linear_model#调用sklearn的线性回归包
model = linear_model.LogisticRegression(penalty='l2', C=1.0)
model.fit(x, y.ravel())
print(model.score(x, y))
2.6 Evaluating logistic regression(评估logistic回归)
final_theta = result2[0]
# 定义预测函数
def predict(theta,x):
    probability = sigmoid(x @ theta)
    return [1 if i>=0.5 else 0 for i in probability]
predictions = predict(final_theta,x)

correct = [1 if a==b else 0 for (a,b) in zip(predictions,y)]
accuracy = sum(correct) / len(correct)
print(accuracy)
或者用skearn中的方法来评估结果。
from sklearn.metrics import classification_report
print(classification_report(y, predictions))
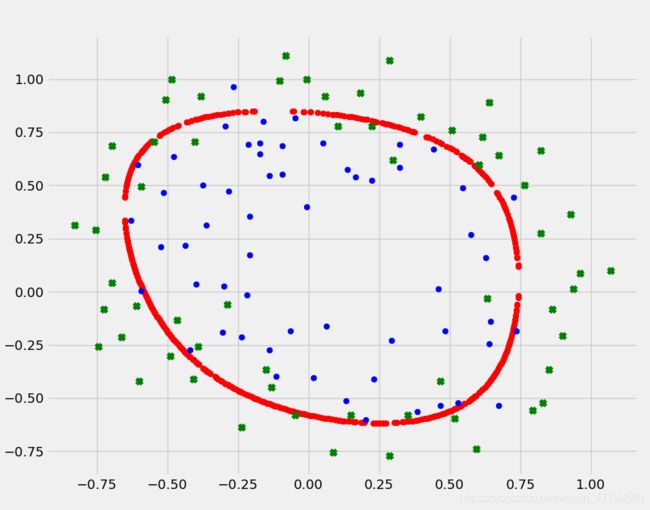
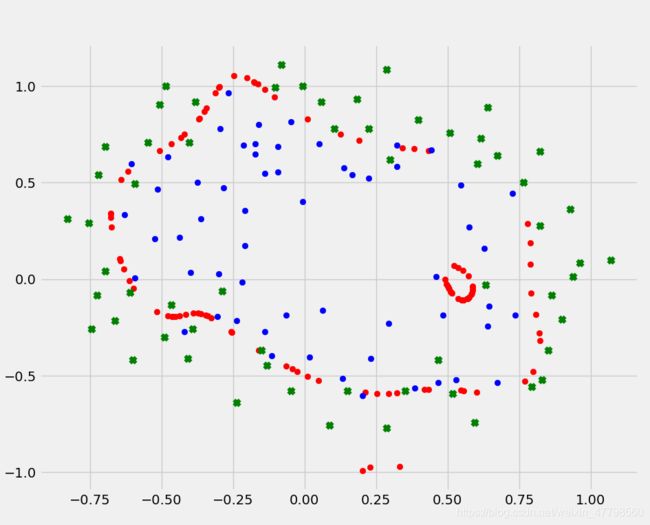
2.7 Decision boundary(决策边界)
# 画出决定边界
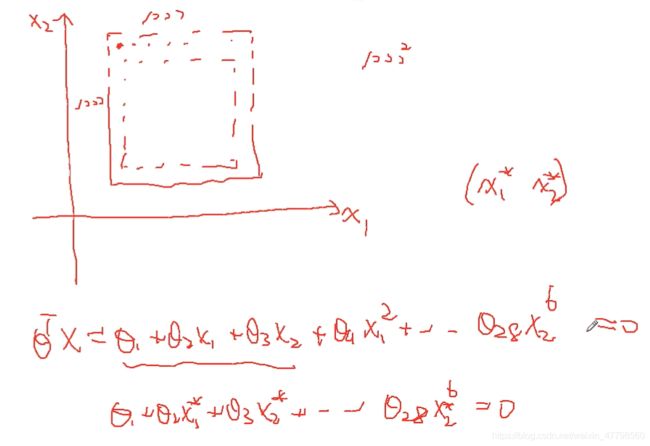
density = 1000
threshhold = 2 * 10 ** -3
def find_decision_boundary(density, power, theta, threshhold):
    t1 = np.linspace(-1, 1.5, density)
    t2 = np.linspace(-1, 1.5, density)
    cordinates = [(x, y) for x in t1 for y in t2]
    x_cord, y_cord = zip(*cordinates)
    mapped_cord = feature_mapping(power,x_cord, y_cord)  # this is a dataframe
    inner_product = mapped_cord.values @ theta
    decision = mapped_cord[np.abs(inner_product) < threshhold]
    # f10和f01分别为x,y
    return decision.f10, decision.f01
    # 寻找决策边界函数
x, y = find_decision_boundary(density, 6, final_theta, threshhold)
plt.figure(figsize=(10,8),dpi = 50)
plt.scatter(x,y,color = 'red')
postive = data2[data2.Accepted.isin(['1'])]
negetive = data2[data2.Accepted.isin(['0'])]
plt.scatter(postive['Test1'],postive['Test2'],label = 'postive',color = 'blue')
plt.scatter(negetive['Test1'],negetive['Test2'],label = 'negetive',color = 'green',marker= 'x')
plt.legend()
plt.show()
