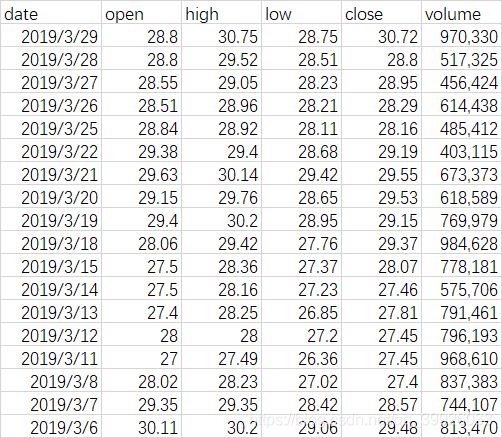
照抄Python绘制MACD指标图的代码,出错该怎么办
下面是抄这篇的文章←点这
# 处理时间标签
from datetime import datetime
# 图形参数控制
import pylab as pl
# 导入及处理数据
import pandas as pd
# 绘图
import matplotlib.pyplot as plt
import matplotlib as mpl
# 解决一些编辑器(VSCode)或IDE(PyCharm)等存在的图片显示问题,
# 应用Tkinter绘图,以便对图形进行放缩操作
mpl.use('TkAgg')

# 导入数据并做处理
def import_csv(stock_code):
    df = pd.read_csv(stock_code + '.csv')
    df.rename(columns={
        'date': 'Date',
        'open': 'Open',
        'high': 'High',
        'low': 'Low',
        'close': 'Close',
        'volume': 'Volume'
    },
        inplace=True)
    df['Date'] = pd.to_datetime(df['Date'], format='%Y/%m/%d')
    df.set_index(['Date'], inplace=True)
    return df


stock_code = 'sh600519'
# 绘制数据的规模scale
scale = 100
df = import_csv(stock_code)[-scale:]

# EMA(Exponential Moving Average), 指数移动平均线
num_periods_fast = 10  # 快速EMA的时间周期,10
# K:平滑常数,常取2/(n+1)
K_fast = 2 / (num_periods_fast + 1)  # 快速EMA平滑常数
ema_fast = 0
num_periods_slow = 40  # 慢速EMA的时间周期,40
K_slow = 2 / (num_periods_slow + 1)  # 慢速EMA平滑常数
ema_slow = 0
num_periods_macd = 20  # MACD EMA的时间周期,20
K_macd = 2 / (num_periods_macd + 1)  # MACD EMA平滑常数
ema_macd = 0

ema_fast_values = []
ema_slow_values = []
macd_values = []
macd_signal_values = []
# MACD - MACD-EMA
MACD_hist_values = []
for close_price in df['Close']:
    if ema_fast == 0:  # 第一个值
        ema_fast = close_price
        ema_slow = close_price
    else:
        ema_fast = (close_price - ema_fast) * K_fast + ema_fast
        ema_slow = (close_price - ema_slow) * K_slow + ema_slow

    ema_fast_values.append(ema_fast)
    ema_slow_values.append(ema_slow)

	# MACD is fast_MA - slow_EMA
    macd = ema_fast - ema_slow
    if ema_macd == 0:
        ema_macd = macd
    else:
    	# signal is EMA of MACD values
        ema_macd = (macd - ema_macd) * K_macd + ema_macd
    macd_values.append(macd)
    macd_signal_values.append(ema_macd)
    MACD_hist_values.append(macd - ema_macd)

df = df.assign(ClosePrice=pd.Series(df['Close'], index=df.index))
df = df.assign(FastEMA10d=pd.Series(ema_fast_values, index=df.index))
df = df.assign(SlowEMA40d=pd.Series(ema_slow_values, index=df.index))
df = df.assign(MACD=pd.Series(macd_values, index=df.index))
df = df.assign(EMA_MACD20d=pd.Series(macd_signal_values, index=df.index))
df = df.assign(MACD_hist=pd.Series(MACD_hist_values, index=df.index))

close_price = df['ClosePrice']
ema_f = df['FastEMA10d']
ema_s = df['SlowEMA40d']
macd = df['MACD']
ema_macd = df['EMA_MACD20d']
macd_hist = df['MACD_hist']

# 设置画布,纵向排列的三个子图
fig, ax = plt.subplots(3, 1)

# 设置标签显示中文
plt.rcParams['font.sans-serif'] = ['SimHei']
plt.rcParams['axes.unicode_minus'] = False

# 调整子图的间距,hspace表示高(height)方向的间距
plt.subplots_adjust(hspace=.1)

# 设置第一子图的y轴信息及标题
ax[0].set_ylabel('Close price in ¥')
ax[0].set_title('A_Stock %s MACD Indicator' % stock_code)
close_price.plot(ax=ax[0], color='g', lw=1., legend=True, use_index=False)
ema_f.plot(ax=ax[0], color='b', lw=1., legend=True, use_index=False)
ema_s.plot(ax=ax[0], color='r', lw=1., legend=True, use_index=False)

# 应用同步缩放
ax[1] = plt.subplot(312, sharex=ax[0])
macd.plot(ax=ax[1], color='k', lw=1., legend=True, sharex=ax[0], use_index=False)
ema_macd.plot(ax=ax[1], color='g', lw=1., legend=True, use_index=False)

# 应用同步缩放
ax[2] = plt.subplot(313, sharex=ax[0])
df['MACD_hist'].plot(ax=ax[2], color='r', kind='bar', legend=True, sharex=ax[0])

# 设置间隔,以便图形横坐标可以正常显示(否则数据多了x轴会重叠)
interval = scale // 20
# 设置x轴参数,应用间隔设置
# 时间序列转换,(否则日期默认会显示时分秒数据00:00:00)
# x轴标签旋转便于显示
pl.xticks([i for i in range(1, scale + 1, interval)],
          [datetime.strftime(i, format='%Y-%m-%d') for i in \
           pd.date_range(df.index[0], df.index[-1], freq='%dd' % (interval))],
          rotation=45)
plt.show()
运行之后,就报错的。
错误如下:
Traceback (most recent call last):
  File "c:/Users/最繎系坚果丶/Desktop/Python期末项目/textt.py", line 121, in <module>
    pl.xticks([i for i in range(1, scale + 1, interval)],
  File "C:\Users\最繎系坚果丶\AppData\Local\Programs\Python\Python38\lib\site-packages\matplotlib\pyplot.py", line 1659, in xticks
    labels = ax.set_xticklabels(labels, **kwargs)
  File "C:\Users\最繎系坚果丶\AppData\Local\Programs\Python\Python38\lib\site-packages\matplotlib\axes\_base.py", line 63, in wrapper
    return get_method(self)(*args, **kwargs)
  File "C:\Users\最繎系坚果丶\AppData\Local\Programs\Python\Python38\lib\site-packages\matplotlib\cbook\deprecation.py", line 451, in wrapper
    return func(*args, **kwargs)
  File "C:\Users\最繎系坚果丶\AppData\Local\Programs\Python\Python38\lib\site-packages\matplotlib\axis.py", line 1796, in _set_ticklabels
    return self.set_ticklabels(labels, minor=minor, **kwargs)
  File "C:\Users\最繎系坚果丶\AppData\Local\Programs\Python\Python38\lib\site-packages\matplotlib\axis.py", line 1717, in set_ticklabels
    raise ValueError(
ValueError: The number of FixedLocator locations (20), usually from a call to set_ticks, does not match the number of ticklabels (10).
这应该怎么解决啊
