python画图plt函数学习
python中的绘图工具 :matplotli,专门用于画图。
一. 安装与导入
工具包安装:conda install matplotli
导入:import matplotlib.pyplot as plt
画图主要有:列表绘图;多图绘图;数组绘图
二. 列表绘图
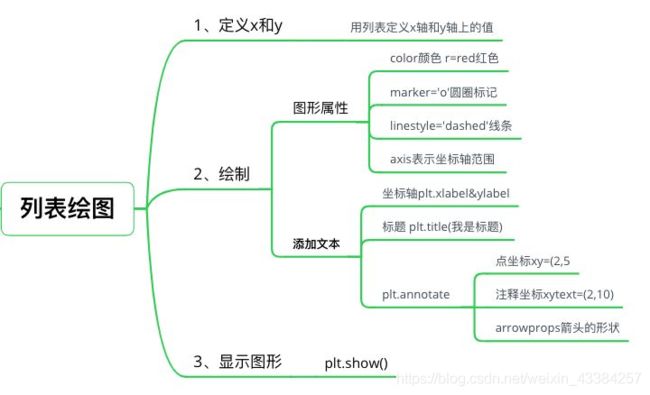
1. 基础绘图:plt.plot;plt.show
import matplotlib.pyplot as plt
x = [1, 2, 3, 4]
y = [1, 4, 9, 16]
plt.plot(x, y)
plt.show()

2. 画图设置属性
画图属性设置
| r | g | b | y | k |
|---|---|---|---|---|
| 红色 | 绿色 | 蓝色 | 黄色 | 黑色 |
| - | – | : | -。 |
|---|---|---|---|
| 实线 | 虚线 | 点线 | 点横线 |
| + | o | * | . | x | s | d | ^ | v | p |
|---|---|---|---|---|---|---|---|---|---|
| 加号 | 圆圈 | 星号 | 实心点 | 叉号 | 正方形 | 钻石形 | 上三角 | 下三角 | 五角星 |
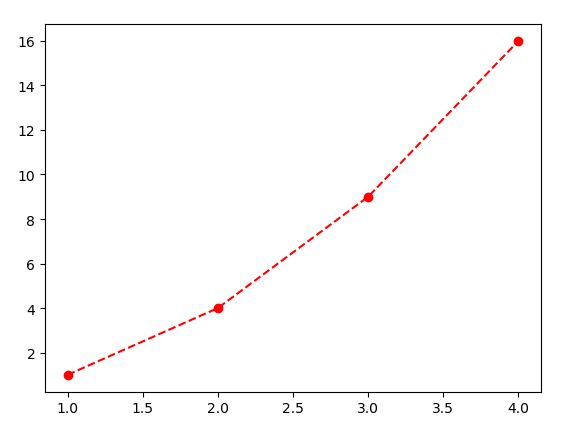
import matplotlib.pyplot as plt
x = [1, 2, 3, 4]
y = [1, 4, 9, 16]
# plt.plot(x, y, color='r', marker='o', linestyle='--')
plt.plot(x, y, 'ro--')  # 该行为上一句的简写
plt.show()
3. 坐标轴的属性
(1)x、y坐标名称设置
plt.xlabel('x')
plt.ylabel('y')
(2)设置x、y范围
主要参考博客
plt.axis([a, b, c, d]) 设置x轴的范围为[a, b],y轴的范围为[c, d]
plt.axis('equal') x,y轴刻度等长
plt.axis('square') 作图为正方形,并且x,y轴范围相同
(3)坐标间隔设定
参考博客
plt.xticks(参数一,参数二,参数三) 用来实现对x轴和y轴坐标间隔(也就是轴记号)的设定。
- 参数一:x或者y的参数
- 参数二:新的标签
- 参数三:旋转角度
import matplotlib.pyplot as plt
x = [1, 2, 3, 4]
y = [1, 4, 9, 6]
labels = ['Frogs', 'Hogs', 'Bogs', 'Slogs']
plt.plot(x, y)
# You can specify a rotation for the tick labels in degrees or with keywords.
plt.xticks(x, labels, rotation='vertical')
plt.show()
4. 坐标轴移动
参考博客
ax = plt.gca() 获取当前坐标轴,总共有四个轴top、bottom、left和right
ax.spines[‘bottom’] 获取底部的轴,获取哪个轴,则参数中写哪个
ax.spines['right'].set_color('none') 隐藏了右侧的坐标轴
ax.spines['top'].set_color('none') 隐藏了左侧的坐标轴
ax.xaxis.set_ticks_position('bottom') 要挪动底部的X轴,所以先目光锁定底部。
ax.spines['bottom'].set_position(('data',0)) 在这里,position位置参数有三种,这里用到了“按Y轴刻度位置挪动”,'data’表示按数值挪动,其后数字代表挪动到Y轴的刻度值
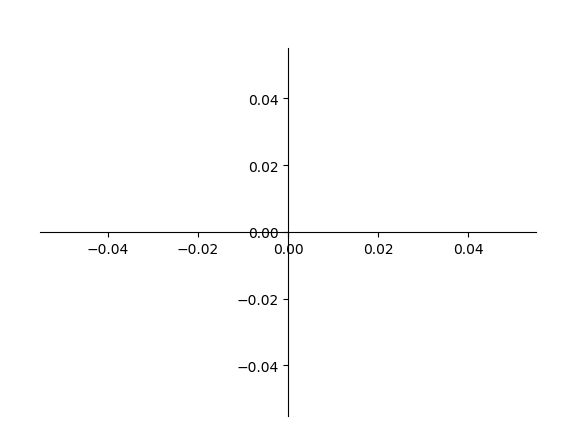
则移动坐标轴位置的代码变为:
import matplotlib.pyplot as plt
plt.figure(1)
plt.plot()
ax = plt.gca()
ax.xaxis.set_ticks_position('bottom')
ax.spines['bottom'].set_position(('data',0))
ax.yaxis.set_ticks_position('left')
ax.spines['left'].set_position(('data',0))
ax.spines['top'].set_color('none')  # 设置顶部支柱的颜色为空
ax.spines['right'].set_color('none')  # 设置右边支柱的颜色为空
plt.show()
5. 图片上添加文本和网格
(1)plt.title('标题') 添加标题,可以参考博客
(2)plt.annotate() 添加注释,可以参考博客
import matplotlib.pyplot as plt
x=[1, 2, 3, 4]
y=[1, 4, 9, 16]
plt.plot(x, y)
plt.xlabel('x坐标轴')
#y轴文本
plt.ylabel('y坐标轴')
#标题
plt.title('Title')
#添加注释 参数名xy:箭头注释中箭头所在位置,参数名xytext:注释文本所在位置,
#arrowprops在xy和xytext之间绘制箭头, shrink表示注释点与注释文本之间的图标距离
plt.annotate('I am zhushi', xy=(2,5), xytext=(2, 10),
            arrowprops=dict(facecolor='black', shrink=0.01),
            )
#第3步:显示图形
plt.show()

(3) plt.legend() 右上角显示各个曲线代表什么意思。
import matplotlib.pyplot as plt
import numpy as np
plt.rcParams['font.sans-serif'] = ['SimHei']
plt.rcParams['axes.unicode_minus'] = False
n = np.linspace(-5, 4, 30)
m1 = 3 * n + 2
m2 = n ** 2
plt.xlabel('时间')
plt.ylabel('心情')
plt.plot(n, m1, color='r', linewidth=1.5, linestyle='-', label='女生购物欲望')
plt.plot(n, m2, 'b', label='男生购物欲望')
plt.legend()  # 右上角显示各个曲线代表什么意思
plt.show()

(4)是否显示网格
import matplotlib as mpl
import matplotlib.pyplot as plt
plt.grid() # 显示网格线 1=True=默认显示;0=False=不显示
plt.grid(1) # 显示网格线
plt.grid(True) # 显示网格线
plt.grid(b=True) # 显示网格线
plt.grid(b=1) # 显示网格线
plt.grid(b=True, axis='x') #只显示x轴网格线
plt.grid(b=True, axis='y') #只显示y轴网格线
三、多图绘制

如何使用Python创建多个画板和画纸来绘制多幅图,如果事先不声明画板画板,默认是创建一个画板一个画纸
- 使用figure()方法创建画板1
- 使用subplot()方法创建画纸,并选择当前画纸并绘图
- 最后显示图形
figure()函数可以帮助我们同时处理生成多个图,而subplot()函数则用来实现,在一个大图中,出现多个小的子图。
处理哪个figure,则选择哪个figure,再进行画图。
参考博客
import matplotlib.pyplot as plt
import numpy as np

x = np.arange(-1, 1, 0.1)

plt.figure(1) # 生成第一个图,且当前要处理的图为fig.1

plt.subplot(1, 2, 1) # fig.1是一个一行两列布局的图,且现在画的是左图
y1 = np.exp(x)
plt.plot(x, y1, color="r", linestyle="-", marker="^", linewidth=1) # 画图
plt.xlabel("x")
plt.ylabel("y1")

plt.figure(2) # 生成第二个图,且当前要处理的图为fig.2
y2 = np.exp(2 * x)
plt.plot(x, y2, color="k", linestyle="-", marker="s", linewidth=1) # 画图,fig.2是一张整图,没有子图,默认subplot(1, 1, 1)
plt.xlabel("x")
plt.ylabel("y2")

plt.figure(1)  # 当前要处理的图为fig.1,而且当前图是fig.1的左图
plt.subplot(1, 2, 2) # 当前图变为fig.1的右图
y3 = np.exp(1.5 * x)
plt.plot(x, y3, color="b", linestyle="-", marker="v", linewidth=1)
plt.xlabel("x")
plt.ylabel("y3")

plt.show()
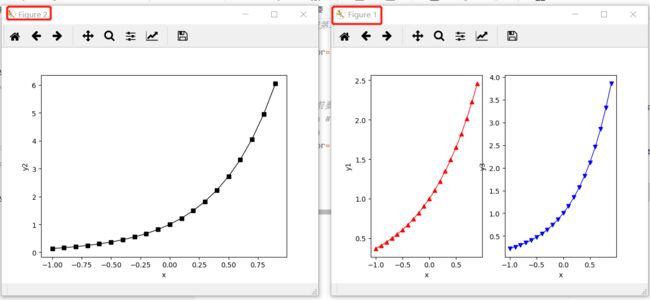
其他属性则与上一节二一样设置。
也可以将subplot子图设置为ax,然后对ax进行画图,则常用设置即为:
ax.set_xlabel('x')	    #设置x轴名称
ax.set_ylabel('y')	    #设置y轴名称
ax.set_title('title')	#设置标题
ax.legend()	            #设置图例:
#方法1:
# ax.plot(x1,y1,label='label1',x2,y2,label='label1') ax.legend()
#方法2:
# ax.plot(x1,y1,,x2,y2) ax.legend(('label1', 'label2'))
#可设置图例位置属性:ax.legend(loc='best'),其他位置包括:'upper right','upper left', 'lower right','lower left','center'等
ax.set_xlim(0,5)       #设置x轴范围
ax.set_ylim(0,5)       #设置y轴范围
ax.set_xticks((0, 2, 4, 6))  #设置x轴刻度
ax.set_xticks((0, 2, 4, 6))  #设置y轴刻度
ax.set_xticklabels(labels=['x1','x2','x3','x4'],rotation=30,fontsize='small')  #设置x刻度的显示文本
ax.set_yticklabels()    #设置y刻度的显示文本,同上
ax.text()               #指定位置显示文本
ax.annotate()           #添加标注,参数:注释文本、指向点、文字位置、箭头属性
ax.grid()               #显示网格
修改上述代码则为:
import matplotlib.pyplot as plt
import numpy as np

x = np.arange(-1, 1, 0.1)

plt.figure(1) # 生成第一个图,且当前要处理的图为fig.1

ax1 = plt.subplot(1, 2, 1) # fig.1是一个一行两列布局的图,且现在画的是左图
y1 = np.exp(x)
plt.plot(x, y1, color="r", linestyle="-", marker="^", linewidth=1) # 画图
ax1.set_xlabel("x")
ax1.set_ylabel("y1")

plt.figure(2) # 生成第二个图,且当前要处理的图为fig.2
y2 = np.exp(2 * x)
plt.plot(x, y2, color="k", linestyle="-", marker="s", linewidth=1) # 画图,fig.2是一张整图,没有子图,默认subplot(1, 1, 1)
plt.xlabel("x")
plt.ylabel("y2")

plt.figure(1)  # 当前要处理的图为fig.1,而且当前图是fig.1的左图
ax2 = plt.subplot(1, 2, 2) # 当前图变为fig.1的右图
y3 = np.exp(1.5 * x)
plt.plot(x, y3, color="b", linestyle="-", marker="v", linewidth=1)
ax2.set_xlabel("x")
ax2.set_ylabel("y3")

plt.show()
四. 数组绘图
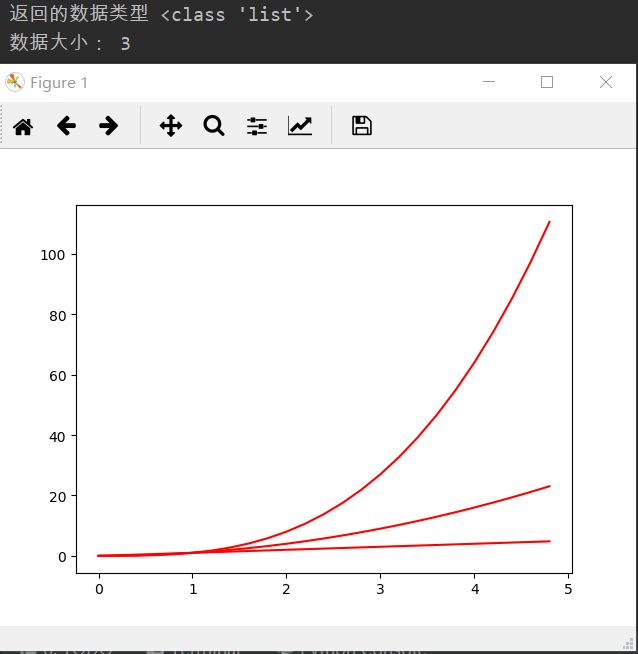
就是根据数组和函数进行绘图,和上面没什么区别。
#多图绘制
import matplotlib.pyplot as plt
#导入包numpy
import numpy as np
#定义一维数组
t = np.arange(0, 5, 0.2)


#使用数组同时绘制多个线性

#线条1
x1=y1=t
#线条2
x2=x1
y2=t**2
#线条3
x3=x1
y3=t**3
#使用plot绘制线条
linesList=plt.plot(x1, y1,
         x2, y2,
         x3, y3 )
#用setp方法可以同时设置多个线条的属性
plt.setp(linesList, color='r')
plt.show()
print('返回的数据类型',type(linesList))
print('数据大小:',len(linesList))
