import numpy as np
import pandas as pd
from pandas_datareader import data
import datetime as dt
数据准备
'''
获取国内股票数据的方式是:“股票代码”+“对应股市”(港股为.hk,A股为.ss)
例如腾讯是港股是:0700.hk
'''
'''
定义函数
函数功能:计算股票涨跌幅=(现在股价-买入价格)/买入价格
输入参数:column是收盘价这一列的数据
返回数据:涨跌幅
'''
def change ( column) :
buyPrice= column[ 0 ]
curPrice= column[ column. size- 1 ]
priceChange= ( curPrice- buyPrice) / buyPrice
if priceChange> 0 :
print ( '股票累计上涨=' , round ( priceChange* 100 , 2 ) , '%' )
elif priceChange== 0 :
print ( '股票无变化=' , round ( priceChange* 100 , 2 ) * 100 , '%' )
else :
print ( '股票累计下跌=' , round ( priceChange* 100 , 2 ) * 100 , '%' )
return priceChange
'''
三星电子
每日股票价位信息
Open:开盘价
High:最高加
Low:最低价
Close:收盘价
Volume:成交量
因雅虎连接不到,仅以三星作为获取数据示例
'''
sxDf = data. DataReader( '005930' , 'naver' , start= '2021-01-01' , end= '2022-01-01' )
sxDf. head( )
Open
High
Low
Close
Volume
Date
2021-01-04
81000
84400
80200
83000
38655276
2021-01-05
81600
83900
81600
83900
35335669
2021-01-06
83300
84500
82100
82200
42089013
2021-01-07
82800
84200
82700
82900
32644642
2021-01-08
83300
90000
83000
88800
59013307
sxDf. info( )
DatetimeIndex: 248 entries, 2021-01-04 to 2021-12-30
Data columns (total 5 columns):
 #   Column  Non-Null Count  Dtype
---  ------  --------------  -----
 0   Open    248 non-null    object
 1   High    248 non-null    object
 2   Low     248 non-null    object
 3   Close   248 non-null    object
 4   Volume  248 non-null    object
dtypes: object(5)
memory usage: 11.6+ KB
sxDf. iloc[ : , 0 : 4 ] = sxDf. iloc[ : , 0 : 4 ] . astype( 'float' )
sxDf. iloc[ : , - 1 ] = sxDf. iloc[ : , - 1 ] . astype( 'int' )
sxDf. info( )
DatetimeIndex: 248 entries, 2021-01-04 to 2021-12-30
Data columns (total 5 columns):
 #   Column  Non-Null Count  Dtype
---  ------  --------------  -----
 0   Open    248 non-null    float64
 1   High    248 non-null    float64
 2   Low     248 non-null    float64
 3   Close   248 non-null    float64
 4   Volume  248 non-null    int32
dtypes: float64(4), int32(1)
memory usage: 10.7 KB
阿里巴巴
AliDf= pd. read_excel( r'C:\Users\EDY\Desktop\吧哩吧啦\学习\Untitled Folder\阿里巴巴2017年股票数据.xlsx' , index_col= 'Date' )
AliDf. tail( )
Open
High
Low
Close
Adj Close
Volume
Date
2017-12-22
175.839996
176.660004
175.039993
176.289993
176.289993
12524700
2017-12-26
174.550003
175.149994
171.729996
172.330002
172.330002
12913800
2017-12-27
172.289993
173.869995
171.729996
172.970001
172.970001
10152300
2017-12-28
173.039993
173.529999
171.669998
172.300003
172.300003
9508100
2017-12-29
172.279999
173.669998
171.199997
172.429993
172.429993
9704600
AliDf. info( )
DatetimeIndex: 251 entries, 2017-01-03 to 2017-12-29
Data columns (total 6 columns):
 #   Column     Non-Null Count  Dtype
---  ------     --------------  -----
 0   Open       251 non-null    float64
 1   High       251 non-null    float64
 2   Low        251 non-null    float64
 3   Close      251 non-null    float64
 4   Adj Close  251 non-null    float64
 5   Volume     251 non-null    int64
dtypes: float64(5), int64(1)
memory usage: 13.7 KB
AliChange= change( AliDf[ 'Close' ] )
股票累计上涨= 94.62 %
'''增加一列累计增长百分比'''
Close1= AliDf[ 'Close' ] [ 0 ]
AliDf[ 'sum_pct_change' ] = AliDf[ 'Close' ] . apply ( lambda x: ( x- Close1) / Close1)
AliDf[ 'sum_pct_change' ] . tail( )
Date
2017-12-22    0.989729
2017-12-26    0.945034
2017-12-27    0.952257
2017-12-28    0.944695
2017-12-29    0.946162
Name: sum_pct_change, dtype: float64
谷歌
GoogleDf= pd. read_excel( r'C:\Users\EDY\Desktop\吧哩吧啦\学习\Untitled Folder\谷歌2017年股票数据.xlsx' , index_col= 'Date' )
GoogleDf. tail( )
Open
High
Low
Close
Adj Close
Volume
Date
2017-12-22
1061.109985
1064.199951
1059.439941
1060.119995
1060.119995
755100
2017-12-26
1058.069946
1060.119995
1050.199951
1056.739990
1056.739990
760600
2017-12-27
1057.390015
1058.369995
1048.050049
1049.369995
1049.369995
1271900
2017-12-28
1051.599976
1054.750000
1044.770020
1048.140015
1048.140015
837100
2017-12-29
1046.719971
1049.699951
1044.900024
1046.400024
1046.400024
887500
GoogleChange= change( GoogleDf[ 'Close' ] )
股票累计上涨= 33.11 %
'''增加一列累计增长百分比'''
Close1= GoogleDf[ 'Close' ] [ 0 ]
GoogleDf[ 'sum_pct_change' ] = GoogleDf[ 'Close' ] . apply ( lambda x: ( x- Close1) / Close1)
GoogleDf[ 'sum_pct_change' ] . tail( )
Date
2017-12-22    0.348513
2017-12-26    0.344213
2017-12-27    0.334839
2017-12-28    0.333274
2017-12-29    0.331061
Name: sum_pct_change, dtype: float64
苹果
AppleDf= pd. read_excel( r'C:\Users\EDY\Desktop\吧哩吧啦\学习\Untitled Folder\苹果2017年股票数据.xlsx' , index_col= 'Date' )
AppleDf. tail( )
Open
High
Low
Close
Adj Close
Volume
Date
2017-12-22
174.679993
175.419998
174.500000
175.009995
174.299362
16349400
2017-12-26
170.800003
171.470001
169.679993
170.570007
169.877396
33185500
2017-12-27
170.100006
170.779999
169.710007
170.600006
169.907272
21498200
2017-12-28
171.000000
171.850006
170.479996
171.080002
170.385315
16480200
2017-12-29
170.520004
170.589996
169.220001
169.229996
168.542831
25999900
AppleChange= change( AppleDf[ 'Close' ] )
股票累计上涨= 45.7 %
'''增加一列累计增长百分比'''
Close1= AppleDf[ 'Close' ] [ 0 ]
AppleDf[ 'sum_pct_change' ] = AppleDf[ 'Close' ] . apply ( lambda x: ( x- Close1) / Close1)
AppleDf[ 'sum_pct_change' ] . tail( )
Date
2017-12-22    0.506758
2017-12-26    0.468532
2017-12-27    0.468790
2017-12-28    0.472923
2017-12-29    0.456995
Name: sum_pct_change, dtype: float64
腾讯
TencentDf= pd. read_excel( r'C:\Users\EDY\Desktop\吧哩吧啦\学习\Untitled Folder\腾讯2017年股票数据.xlsx' , index_col= 'Date' )
TencentDf. tail( )
Open
High
Low
Close
Adj Close
Volume
Date
2017-12-22
403.799988
405.799988
400.799988
405.799988
405.799988
16146080
2017-12-27
405.799988
407.799988
401.000000
401.200012
401.200012
16680601
2017-12-28
404.000000
408.200012
402.200012
408.200012
408.200012
11662053
2017-12-29
408.000000
408.000000
403.399994
406.000000
406.000000
16601658
2018-01-02
406.000000
406.000000
406.000000
406.000000
406.000000
0
TencentDf[ [ 'Open' , 'High' , 'Low' , 'Close' , 'Adj Close' ] ] = TencentDf[ [ 'Open' , 'High' , 'Low' , 'Close' , 'Adj Close' ] ] * 0.1277
TencentDf. tail( )
Open
High
Low
Close
Adj Close
Volume
Date
2017-12-22
51.565258
51.820658
51.182158
51.820658
51.820658
16146080
2017-12-27
51.820658
52.076058
51.207700
51.233242
51.233242
16680601
2017-12-28
51.590800
52.127142
51.360942
52.127142
52.127142
11662053
2017-12-29
52.101600
52.101600
51.514179
51.846200
51.846200
16601658
2018-01-02
51.846200
51.846200
51.846200
51.846200
51.846200
0
TencentChange= change( TencentDf[ 'Close' ] )
股票累计上涨= 114.36 %
'''增加一列累计增长百分比'''
Close1= TencentDf[ 'Close' ] [ 0 ]
TencentDf[ 'sum_pct_change' ] = TencentDf[ 'Close' ] . apply ( lambda x: ( x- Close1) / Close1)
TencentDf[ 'sum_pct_change' ] . tail( )
Date
2017-12-22    1.142555
2017-12-27    1.118268
2017-12-28    1.155227
2017-12-29    1.143611
2018-01-02    1.143611
Name: sum_pct_change, dtype: float64
亚马逊
AmazonDf= pd. read_excel( r'C:\Users\EDY\Desktop\吧哩吧啦\学习\Untitled Folder\亚马逊2017年股票数据.xlsx' , index_col= 'Date' )
AmazonDf. tail( )
Open
High
Low
Close
Adj Close
Volume
Date
2017-12-22
1172.079956
1174.619995
1167.829956
1168.359985
1168.359985
1585100
2017-12-26
1168.359985
1178.319946
1160.550049
1176.760010
1176.760010
2005200
2017-12-27
1179.910034
1187.290039
1175.609985
1182.260010
1182.260010
1867200
2017-12-28
1189.000000
1190.099976
1184.380005
1186.099976
1186.099976
1841700
2017-12-29
1182.349976
1184.000000
1167.500000
1169.469971
1169.469971
2688400
AmazonChange= change( AmazonDf[ 'Close' ] )
股票累计上涨= 55.17 %
'''增加一列累计增长百分比'''
Close1= AmazonDf[ 'Close' ] [ 0 ]
AmazonDf[ 'sum_pct_change' ] = AmazonDf[ 'Close' ] . apply ( lambda x: ( x- Close1) / Close1)
AmazonDf[ 'sum_pct_change' ] . tail( )
Date
2017-12-22    0.550228
2017-12-26    0.561373
2017-12-27    0.568671
2017-12-28    0.573766
2017-12-29    0.551700
Name: sum_pct_change, dtype: float64
Facebook
FacebookDf= pd. read_excel( r'C:\Users\EDY\Desktop\吧哩吧啦\学习\Untitled Folder\Facebook2017年股票数据.xlsx' , index_col= 'Date' )
FacebookDf. tail( )
Open
High
Low
Close
Adj Close
Volume
Date
2017-12-22
177.139999
177.529999
176.229996
177.199997
177.199997
8509500
2017-12-26
176.630005
177.000000
174.669998
175.990005
175.990005
8897300
2017-12-27
176.550003
178.440002
176.259995
177.619995
177.619995
9496100
2017-12-28
177.949997
178.940002
177.679993
177.919998
177.919998
12220800
2017-12-29
178.000000
178.850006
176.460007
176.460007
176.460007
10261500
FacebookChange= change( FacebookDf[ 'Close' ] )
股票累计上涨= 51.0 %
'''增加一列每日增长百分比'''
FacebookDf[ 'pct_change' ] = FacebookDf[ 'Close' ] . pct_change( 1 ) . fillna( 0 )
FacebookDf[ 'pct_change' ] . head( )
Date
2017-01-03    0.000000
2017-01-04    0.015660
2017-01-05    0.016682
2017-01-06    0.022707
2017-01-09    0.012074
Name: pct_change, dtype: float64
'''增加一列累计增长百分比'''
Close1= FacebookDf[ 'Close' ] [ 0 ]
FacebookDf[ 'sum_pct_change' ] = FacebookDf[ 'Close' ] . apply ( lambda x: ( x- Close1) / Close1)
FacebookDf[ 'sum_pct_change' ] . tail( )
Date
2017-12-22    0.516344
2017-12-26    0.505990
2017-12-27    0.519938
2017-12-28    0.522506
2017-12-29    0.510012
Name: sum_pct_change, dtype: float64
数据可视化
import matplotlib. pyplot as plt
fig= plt. figure( figsize= ( 10 , 5 ) )
AliDf. plot( x= 'Volume' , y= 'Close' , kind= 'scatter' )
plt. xlabel( '成交量' )
plt. ylabel( '股价' )
plt. title( '成交量与股价之间的关系' )
plt. show( )
AliDf. corr( )
Open
High
Low
Close
Adj Close
Volume
sum_pct_change
Open
1.000000
0.999281
0.998798
0.998226
0.998226
0.424686
0.998226
High
0.999281
1.000000
0.998782
0.999077
0.999077
0.432467
0.999077
Low
0.998798
0.998782
1.000000
0.999249
0.999249
0.401456
0.999249
Close
0.998226
0.999077
0.999249
1.000000
1.000000
0.415801
1.000000
Adj Close
0.998226
0.999077
0.999249
1.000000
1.000000
0.415801
1.000000
Volume
0.424686
0.432467
0.401456
0.415801
0.415801
1.000000
0.415801
sum_pct_change
0.998226
0.999077
0.999249
1.000000
1.000000
0.415801
1.000000
查看各个公司的股价平均值
AliDf[ 'Close' ] . mean( )
141.79179260159364
'''数据准备'''
Close_mean= { 'Alibaba' : AliDf[ 'Close' ] . mean( ) ,
'Google' : GoogleDf[ 'Close' ] . mean( ) ,
'Apple' : AppleDf[ 'Close' ] . mean( ) ,
'Tencent' : TencentDf[ 'Close' ] . mean( ) ,
'Amazon' : AmazonDf[ 'Close' ] . mean( ) ,
'Facebook' : FacebookDf[ 'Close' ] . mean( ) }
CloseMeanSer= pd. Series( Close_mean)
CloseMeanSer. sort_values( ascending= False , inplace= True )
'''绘制柱状图'''
fig= plt. figure( figsize= ( 10 , 5 ) )
CloseMeanSer. plot( kind= 'bar' )
plt. xlabel( '公司' )
plt. ylabel( '股价平均值(美元)' )
plt. title( '2017年各公司股价平均值' )
plt. yticks( np. arange( 0 , 1100 , 100 ) )
plt. grid( True , axis= 'y' )
plt. show( )
亚马逊和谷歌的平均股价很高,远远超过其他4家,但是仅看平均值并不能代表什么,下面从分布和走势方面查看
查看各公司股价分布情况
'''数据准备'''
CloseCollectDf= pd. concat( [ AliDf[ 'Close' ] ,
GoogleDf[ 'Close' ] ,
AppleDf[ 'Close' ] ,
TencentDf[ 'Close' ] ,
AmazonDf[ 'Close' ] ,
FacebookDf[ 'Close' ] ] , axis= 1 )
CloseCollectDf. columns= [ 'Alibaba' , 'Google' , 'Apple' , 'Tencent' , 'Amazon' , 'Facebook' ]
'''绘制箱型图'''
fig= plt. figure( figsize= ( 20 , 10 ) )
fig. suptitle( '2017年各公司股价分布' , fontsize= 18 )
ax1= plt. subplot( 121 )
CloseCollectDf. plot( ax= ax1, kind= 'box' )
plt. xlabel( '公司' )
plt. ylabel( '股价(美元)' )
plt. title( '2017年各公司股价分布' )
plt. grid( True , axis= 'y' )
ax2= plt. subplot( 222 )
CloseCollectDf[ [ 'Google' , 'Amazon' ] ] . plot( ax= ax2, kind= 'box' )
plt. ylabel( '股价(美元)' )
plt. title( '2017年谷歌和亚马逊股价分布' )
plt. grid( True , axis= 'y' )
ax3= plt. subplot( 224 )
CloseCollectDf[ [ 'Alibaba' , 'Apple' , 'Tencent' , 'Facebook' ] ] . plot( ax= ax3, kind= 'box' )
plt. xlabel( '公司' )
plt. ylabel( '股价(美元)' )
plt. title( '2017年阿里、苹果、腾讯、Facebook股价分布' )
plt. grid( True , axis= 'y' )
plt. subplot
plt. show( )
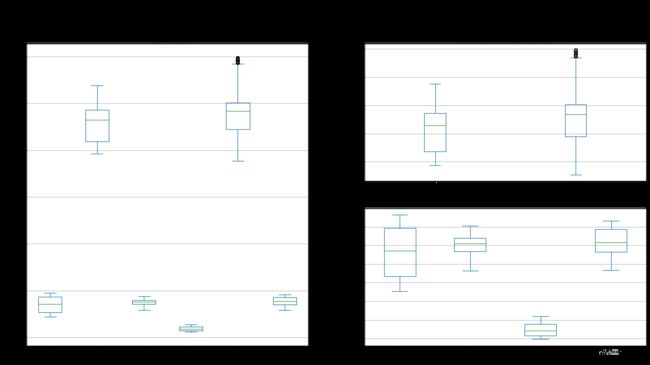
从箱型图看,谷歌和亚马逊的股价分布较广,且中位数偏上,腾讯股价最为集中,波动最小,相对稳定。
股价走势对比
fig= plt. figure( figsize= ( 15 , 10 ) , constrained_layout= True )
fig. suptitle( '股价走势对比' , fontsize= 18 )
'''绘制图像1 '''
ax1= plt. subplot( 211 )
plt. plot( AliDf. index, AliDf[ 'Close' ] , label= 'Alibaba' )
plt. plot( GoogleDf. index, GoogleDf[ 'Close' ] , label= 'Google' )
plt. plot( AppleDf. index, AppleDf[ 'Close' ] , label= 'Apple' )
plt. plot( TencentDf. index, TencentDf[ 'Close' ] , label= 'Tencent' )
plt. plot( AmazonDf. index, AmazonDf[ 'Close' ] , label= 'Amazon' )
plt. plot( FacebookDf. index, FacebookDf[ 'Close' ] , label= 'Facebook' )
plt. xlabel( '时间' )
plt. ylabel( '股价' )
plt. legend( loc= 'upper left' , fontsize= 12 )
plt. xticks( AliDf. index[ : : 10 ] , rotation= 45 )
plt. yticks( np. arange( 0 , 1300 , step= 100 ) )
plt. grid( True )
'''绘制图像2'''
ax2= plt. subplot( 212 )
plt. plot( AliDf. index, AliDf[ 'sum_pct_change' ] , label= 'Alibaba' )
plt. plot( GoogleDf. index, GoogleDf[ 'sum_pct_change' ] , label= 'Google' )
plt. plot( AppleDf. index, AppleDf[ 'sum_pct_change' ] , label= 'Apple' )
plt. plot( TencentDf. index, TencentDf[ 'sum_pct_change' ] , label= 'Tencent' )
plt. plot( AmazonDf. index, AmazonDf[ 'sum_pct_change' ] , label= 'Amazon' )
plt. plot( FacebookDf. index, FacebookDf[ 'sum_pct_change' ] , label= 'Facebook' )
plt. xlabel( '时间' )
plt. ylabel( '累计增长率' )
plt. legend( loc= 'upper left' , fontsize= 12 )
plt. xticks( AliDf. index[ : : 10 ] , rotation= 45 )
plt. yticks( np. arange( 0 , 1.2 , step= 0.1 ) )
plt. grid( True )
plt. show( )
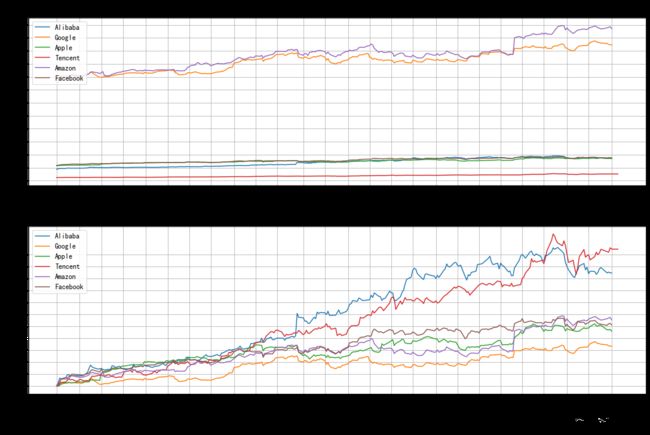
可以看出,在2017年间,亚马逊和谷歌的股价虽然偏高,涨幅却不如阿里巴巴和腾讯。
总结
观察以上图形,可以得出一下结果:


