MATLAB 图像识别
图片例

代码:
f=imread('D:\Users\41644\Downloads\jianbianseqiu-32753507_3.jpg');
f=f(:,:,3);
f=histeq(f,256); %增强对比度
f=im2bw(f,0.386);
% rowhigh=102+276-1; %提取有用部分
% colhigh=193+277-1;
f=f(102:rowhigh,193:colhigh);
se=strel('square',14); %开闭运算
fo=imopen(f,se);
f2=imclose(fo,se);
f2=~f2;
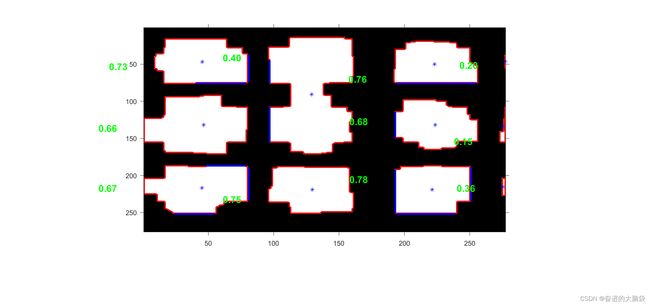
imshow(f2);
g=edge(f2,'sobel',0.47);
[B,L] = bwboundaries(f2,'noholes');
hold on
for k = 1:length(B) % 标记边界
boundary = B{k};
plot(boundary(:,2), boundary(:,1), 'r', 'LineWidth', 2)
end
hold on
[L1,n]=bwlabel(g); %标定质心
ff=imread('D:\Users\41644\Downloads\jianbianseqiu-32753507_3.jpg');
for k=1:n
[r,c]=find(L1==k);
rbar=mean(r);
cbar=mean(c);
plot(cbar,rbar,'Marker','*','MarkerEdgeColor','blue');
fprintf('行坐标为%9.2f , ',cbar)
fprintf('列坐标为%9.2f\n',rbar);
% rgb=ff(floor(cbar)+193,floor(rbar)+102,:) %读取RGB值
end
axis on,axis normal;
[H,theta,rho]=hough(g);%判断直线
peak=houghpeaks(H,11);
lines=houghlines(g,theta,rho,peak,'FillGap',10,'MinLength',31);%
hold on
for k=1:length(lines)
xy=[lines(k).point1;lines(k).point2];
plot(xy(:,1),xy(:,2),'LineWidth',2.5,'Color','blue');
end
l=regionprops(L,'Perimeter','Area'); %求周长,面积
l.Perimeter
l.Area
stats = regionprops(L,'Area','Centroid','Perimeter');
threshold = 0.95;
for k = 1:length(B)
boundary = B{k};
area = stats(k).Area;
%perimeter=stats(k).Perimeter;
delta_sq = diff(boundary).^2;
perimeter = sum(sqrt(sum(delta_sq,2))); %利用4pi*面积/周长^2=1判断圆
metric = 4*pi*area/perimeter^2;
metric_string = sprintf('%2.2f',metric) ;
text(boundary(1,2)-35,boundary(1,1)+13,metric_string,'Color','g',...
'FontSize',14,'FontWeight','bold');
if metric > threshold
centroid = stats(k).Centroid;
text(centroid(1)-10,centroid(2)-10,'圆','Color','b','FontSize',10,'FontWeight','bold');
end
end
只处理部分图片的数据
行坐标为    46.42    , 列坐标为   131.72
行坐标为    45.27    , 列坐标为   217.00
行坐标为    45.48    , 列坐标为    47.10
行坐标为   128.99    , 列坐标为    90.71
行坐标为   129.60    , 列坐标为   219.28
行坐标为   223.10    , 列坐标为    49.89
行坐标为   223.50    , 列坐标为   131.68
行坐标为   221.19    , 列坐标为   219.15
行坐标为   275.34    , 列坐标为   133.53
行坐标为   275.21    , 列坐标为   215.57
行坐标为   277.00    , 列坐标为    46.50