10X单细胞测序分析软件:Cell ranger,从拆库到定量
撰文:周运来,一个读序列天书的公子哥,稳健,潇洒,大方,靠谱。大型测序工厂的螺丝钉,统计草原上的游牧者。 (https://www.jianshu.com/u/06ae70ef31bc)
编辑:陈同
--- 大师,大师,我想学习单细胞
··· 闭上眼睛跟我来
单细胞测序有着漫长的过去,却只有短暂的历史—-谁说的!
说她漫长是因为到如今也有十几年的历史了(这里面两个重要任务:汤富酬老师2009年的文章使得单细胞测序成为现实,郭国冀老师2010年的文章揭示对500多细胞进行48个基因的单细胞RT-qPCR就可以进行细胞类型区分,使得单细胞测序方向转向大量细胞低深度测序),说她短暂是因为针对单细胞的分析工具越来越有意义开发周期却越来越短。一般生物信息流程主要由软件(安装与参数)、数据库(结构和生物学意义)和数据分析(统计学和编程)组成,目前单细胞分析用到的软件主要是FastQC、Cellranger和R包Seurat、monocle;数据库有相应物种的参考基因组、KEGG、GO;数据分析部分主要基于count矩阵和差异表达数据用R或者Python来做。
cellranger是10X genomics公司为单细胞RNA测序分析量身打造的数据分析软件,可以直接输入Illumina 原始数据(raw base call ,BCL或FASTQ)直接进行文库拆分、细胞拆分、输出表达定量矩阵、降维(pca),聚类(Graph-based& K-Means)以及可视化(t-SNE)结果,结合配套的Loupe Cell Browser给予研究者更多探索单细胞数据的机会。cellranger的高度集成化,使得单细胞测序数据探索变得更加简单,研究者有更多的时间来做生物学意义的挖掘。
今天小编就要给大家介绍下这个可能成为行业标准的数据分析软件——cellranger。在这之前,还是先来了解一下10X genomics单细胞测序的一般原理吧。
10X genomics
一个油滴 (GEM)=一个单细胞+一个凝胶微珠=一个scRNA-Seq,可以说这就是10X的基本技术原理。
V2试剂盒产生的文库结构:
V3试剂盒产生的文库结构:
reads 1 :主要用来标记(barcode、UMI以及reads的来源)
reads 2 :与基因组比对 (配合UMI进行定量)
Barcode: 标记细胞
UMI (Unique Molecular Identifier):标记转录本
PolyT :捕获成熟的RNA
10X genomics单细胞测序通过Barcode来标记细胞和细胞计数,UMI 来标记转录本,这样与参考基因组比对后就可以定量基因的表达量 (转录本数量,近乎绝对定量)。
在2019年3月7日10x官方网站对“单细胞基因表达入门”的直播视频中提到(只是一场直播提到的信息,仅供参考):
由于10x单细胞测序的重复性较高,因此如无特殊原因,做生物学重复的意义不大;
如果细胞大小不一致,但直径符合上机要求,对捕获效率没有明显影响;
细胞重悬清洗后要保证钙、镁离子浓度较低,从而不影响反转录;
非常规形态或直径较大的细胞可以采用抽核的方法进行检测;
当被问及测序时需不需要加入标准物(如ERCC)的时候,官方给出的建议是不建议加ERCC(考虑到成本和影响细胞和基因的计数)。
cell ranger pipeline
cellranger单细胞分析流程主要分为:数据拆分 cellranger mkfastq、细胞定量 cellranger count、GEM整合 cellranger aggr、定制调整 cellranger reanalyze。还有一些用户可能会用到的功能:mat2csv、mkgtf、mkref (构建索引)、vdj、mkvdjref、testrun (测试软件是否安装成功和输出结果的结构)、upload、sitecheck。
本文主要介绍常用的mkfastq, count, aggr以及reanlyze。
文库拆分 cellranger mkfastq
封装了Illumina’s bcl2fastq软件,用来拆分Illumina 原始数据(raw base call (BCL)),输出 FASTQ 文件。
cellranger-cs/3.0.0 -h
# 获取帮助信息,篇幅有限就不展示了,可阅读原文或自己运行阅读
# 不展示不代表不重要,做分析不读参数解释就是耍流氓
有以下两种使用方式
$ cellranger mkfastq --id=tiny-bcl \
                     --run=/path/to/tiny_bcl \
                     --csv=cellranger-tiny-bcl-simple-1.2.0.csv

cellranger mkfastq
Copyright (c) 2017 10x Genomics, Inc.  All rights reserved.
-------------------------------------------------------------------------------

Martian Runtime - 3.0.2-v3.2.0
Running preflight checks (please wait)...
2019-03-02 16:33:54 [runtime] (ready)           ID.tiny-bcl.MAKE_FASTQS_CS.MAKE_FASTQS.PREPARE_SAMPLESHEET
2019-03-02 16:33:57 [runtime] (split_complete)  ID.tiny-bcl.MAKE_FASTQS_CS.MAKE_FASTQS.PREPARE_SAMPLESHEET
2019-03-02 16:33:57 [runtime] (run:local)       ID.tiny-bcl.MAKE_FASTQS_CS.MAKE_FASTQS.PREPARE_SAMPLESHEET.fork0.chnk0.main
2019-03-02 16:34:00 [runtime] (chunks_complete) ID.tiny-bcl.MAKE_FASTQS_CS.MAKE_FASTQS.PREPARE_SAMPLESHEETcellranger-tiny-bcl-simple-1.2.0.csv文件结构
只有3列,第一列指定lane ID, 第二列指定样本名称 (来源于哪个GEM well,一般是一份生物样品,一个GEM well对应一个library,可以理解为下图芯片中的一个channel),第三列指定index的名称,10X genomics的每个index代表4条具体的oligo序列,主要用于平衡文库。拆分后的FASTQ文件是一个GEM well中所有细胞的测序结果。
$ cellranger mkfastq --id=tiny-bcl \
                     --run=/path/to/tiny_bcl \
                     --samplesheet=cellranger-tiny-bcl-samplesheet-1.2.0.csv

cellranger mkfastq
Copyright (c) 2017 10x Genomics, Inc.  All rights reserved.
-------------------------------------------------------------------------------

Martian Runtime - 3.0.2-v3.2.0
Running preflight checks (please wait)...
2019-03-02 16:25:49 [runtime] (ready)           ID.tiny-bcl.MAKE_FASTQS_CS.MAKE_FASTQS.PREPARE_SAMPLESHEET
2019-03-02 16:25:52 [runtime] (split_complete)  ID.tiny-bcl.MAKE_FASTQS_CS.MAKE_FASTQS.PREPARE_SAMPLESHEET
2019-03-02 16:25:52 [runtime] (run:local)       ID.tiny-bcl.MAKE_FASTQS_CS.MAKE_FASTQS.PREPARE_SAMPLESHEET.fork0.chnk0.main
2019-03-02 16:25:58 [runtime] (chunks_complete) ID.tiny-bcl.MAKE_FASTQS_CS.MAKE_FASTQS.PREPARE_SAMPLESHEET如果使用samplesheet文件(见下图,一般不用),需要准备的信息就多一些了,比如调整Reads中的序列长度,而使用简化版的csv文件,cell ranger可以识别所用试剂盒版本,然后自动化的调整reads长度。
拆分好之后的目录结构如下所示
├── fastq_path
│   ├── H35KCBCXY
│   │   └── test_sample
│   │       ├── test_sample_S1_L001_I1_001.fastq.gz #index序列
│   │       ├── test_sample_S1_L001_R1_001.fastq.gz #barcode umi
│   │       └── test_sample_S1_L001_R2_001.fastq.gz #reads
注意下FASTQ文件的命名规律,如果我们直接拿到fastq文件,只要命名格式符合,也可以直接进行后续分析。(图中sample name,sample order类比一library name, library well number,见下面aggr部分)
拆库时可以加--qc参数输出序列质量情况,保存在outs/qc_summary.json中 (whitelist见aggr部分):
"sample_qc": {
  "Sample1": {
    "5": {
      "barcode_exact_match_ratio": 0.9336158258904611,
      "barcode_q30_base_ratio": 0.9611993091728814,
      "bc_on_whitelist": 0.9447542078230667,
      "mean_barcode_qscore": 37.770630795934,
      "number_reads": 2748155,
      "read1_q30_base_ratio": 0.8947676653366835,
      "read2_q30_base_ratio": 0.7771883245304577
    },
    "all": {
      "barcode_exact_match_ratio": 0.9336158258904611,
      "barcode_q30_base_ratio": 0.9611993091728814,
      "bc_on_whitelist": 0.9447542078230667,
      "mean_barcode_qscore": 37.770630795934,
      "number_reads": 2748155,
      "read1_q30_base_ratio": 0.8947676653366835,
      "read2_q30_base_ratio": 0.7771883245304577
    }
  }
}
cellranger count
count是cellranger最主要也是最重要的功能:完成细胞和基因的定量,也就是产生了我们用来做各种分析的基因表达矩阵。
cellranger count  -h
cellranger count (3.0.0)
Copyright (c) 2018 10x Genomics, Inc.  All rights reserved.
-------------------------------------------------------------------------------

'cellranger count' quantifies single-cell gene expression.

The commands below should be preceded by 'cellranger':

Usage:
    count
        --id=ID
        [--fastqs=PATH]
        [--sample=PREFIX]
        --transcriptome=DIR
        [options]
    count   [options]
    count -h | --help | --version

Arguments:
    id      A unique run id, used to name output folder [a-zA-Z0-9_-]+.
    fastqs  Path of folder created by mkfastq or bcl2fastq.
    sample  Prefix of the filenames of FASTQs to select.
    transcriptome   Path of folder containing 10x-compatible reference.

Options:
# Single Cell Gene Expression
    --description=TEXT  Sample description to embed in output files.
    --libraries=CSV     CSV file declaring input library data sources.
    --expect-cells=NUM  Expected number of recovered cells.
    --force-cells=NUM   Force pipeline to use this number of cells, bypassing
                            the cell detection algorithm.
    --feature-ref=CSV   Feature reference CSV file, declaring feature-barcode
                             constructs and associated barcodes.
    --nosecondary       Disable secondary analysis, e.g. clustering. Optional.
    --r1-length=NUM     Hard trim the input Read 1 to this length before
                            analysis.
    --r2-length=NUM     Hard trim the input Read 2 to this length before
                            analysis.
    --chemistry=CHEM    Assay configuration. NOTE: by default the assay
                            configuration is detected automatically, which
                            is the recommened mode. You usually will not need
                            to specify a chemistry. Options are: 'auto' for
                            autodetection, 'threeprime' for Single Cell 3',
                            'fiveprime' for  Single Cell 5', 'SC3Pv1' or
                            'SC3Pv2' or 'SC3Pv3' for Single Cell 3' v1/v2/v3,
                            'SC5P-PE' or 'SC5P-R2' for Single Cell 5'.
                            paired-end/R2-only. Default: auto.
    --no-libraries      Proceed with processing using a --feature-ref but no
                            feature-barcoding data specified with the
                            'libraries' flag.
    --lanes=NUMS        Comma-separated lane numbers.
    --indices=INDICES   Comma-separated sample index set "SI-001" or sequences.
    --project=TEXT      Name of the project folder within a mkfastq or
                            bcl2fastq-generated folder to pick FASTQs from.

# Martian Runtime
    --jobmode=MODE      Job manager to use. Valid options:
                            local (default), sge, lsf, or a .template file
    --localcores=NUM    Set max cores the pipeline may request at one time.
                            Only applies when --jobmode=local.
    --localmem=NUM      Set max GB the pipeline may request at one time.
                            Only applies when --jobmode=local.
    --mempercore=NUM    Set max GB each job may use at one time.
                            Only applies in cluster jobmodes.
    --maxjobs=NUM       Set max jobs submitted to cluster at one time.
                            Only applies in cluster jobmodes.
    --jobinterval=NUM   Set delay between submitting jobs to cluster, in ms.
                            Only applies in cluster jobmodes.
    --overrides=PATH    The path to a JSON file that specifies stage-level
                            overrides for cores and memory.  Finer-grained
                            than --localcores, --mempercore and --localmem.
                            Consult the 10x support website for an example
                            override file.
    --uiport=PORT       Serve web UI at http://localhost:PORT
    --disable-ui        Do not serve the UI.
    --noexit            Keep web UI running after pipestance completes or fails.
    --nopreflight       Skip preflight checks.

    -h --help           Show this message.
    --version           Show version.

Note: 'cellranger count' can be called in two ways, depending on how you
demultiplexed your BCL data into FASTQ files.

1. If you demultiplexed with 'cellranger mkfastq' or directly with
   Illumina bcl2fastq, then set --fastqs to the project folder containing
   FASTQ files. In addition, set --sample to the name prefixed to the FASTQ
   files comprising your sample. For example, if your FASTQs are named:
       subject1_S1_L001_R1_001.fastq.gz
   then set --sample=subject1

2. If you demultiplexed with 'cellranger demux', then set --fastqs to a
   demux output folder containing FASTQ files. Use the --lanes and --indices
   options to specify which FASTQ reads comprise your sample.
   This method is deprecated. Please use 'cellranger mkfastq' going forward.
—nosecondary 指定后不进行后续的降维、聚类和可视化分析。一般是只获得矩阵,后续分析用
Seurat。
输出文件解释
.outs
├── analysis【数据分析文件夹】
│   ├── clustering【聚类,图聚类和k-means聚类】
│   ├── diffexp【差异分析】
│   ├── pca【主成分分析线性降维】
│   └── tsne【非线性降维信息】
├── cloupe.cloupe【Loupe Cell Browser 输入文件】
├── filtered_feature_bc_matrix【很重要,Seurat, Monocle的输入文件】
│   ├── barcodes.tsv.gz
│   ├── features.tsv.gz
│   └── matrix.mtx.gz
├── filtered_feature_bc_matrix.h5【过滤掉的barcode信息HDF5 format】
├── metrics_summary.csv【CSV format数据摘要】
├── molecule_info.h5【aggregate的时候会用到的文件】
├── raw_feature_bc_matrix【原始barcode信息】
│   ├── barcodes.tsv.gz
│   ├── features.tsv.gz
│   └── matrix.mtx.gz
├──  possorted_genome_bam.bam【比对文件】
├──  possorted_genome_bam.bam.bai【索引文件】
├── raw_feature_bc_matrix.h5【原始barcode信息HDF5 format】
├── web_summary.html【网页简版报告以及可视化】
└── *_gene_bar.csv_temp【过程文件】
GEM文库整合 cellranger aggr
当实验中用到了多个GEM well,并且想放在一起分析时,需要先用cellranger count分析各个来自于一个GEM well的fastq文件 (与是否同一个lane测序没关系),然后再用cellranger aggr进行整合。
$ cd /home/jdoe/runs
$ cellranger aggr --id=AGG123 \
                  --csv=AGG123_libraries.csv \
                  --normalize=mapped
library_id,molecule_h5
LV123,/opt/runs/LV123/outs/molecule_info.h5
LB456,/opt/runs/LB456/outs/molecule_info.h5
LP789,/opt/runs/LP789/outs/molecule_info.h5library_id,molecule_h5,batch
LV123,/opt/runs/LV123/outs/molecule_info.h5,v2_lib
LB456,/opt/runs/LB456/outs/molecule_info.h5,v3_lib
LP789,/opt/runs/LP789/outs/molecule_info.h5,v3_lib什么是 GEM Wells
每个GEM well是10X芯片上的一个单独的区室,从barcode池 (barcode whitelist,前面--qc的结果中有,评估barcode测序准确度,进而影响细胞鉴定准确度)中随机获取barcode用于标记细胞。为了保证整合多个文库时barcode不发生冲突,通常会在barcode后面加一个数字,标记其来源的GEM well,如AGACCATTGAGACTTA-1和AGACCATTGAGACTTA-2,barcode序列一样,但来源于不同的GEM well,也是不同的细胞。
Outputs:
- Aggregation metrics summary HTML:         /home/jdoe/runs/AGG123/outs/web_summary.html
- Aggregation metrics summary JSON:         /home/jdoe/runs/AGG123/outs/summary.json
- Secondary analysis output CSV:            /home/jdoe/runs/AGG123/outs/analysis
- Filtered feature-barcode matrices MEX:    /home/jdoe/runs/AGG123/outs/filtered_feature_bc_matrix
- Filtered feature-barcode matrices HDF5:   /home/jdoe/runs/AGG123/outs/filtered_feature_bc_matrix.h5
- Unfiltered feature-barcode matrices MEX:  /home/jdoe/runs/AGG123/outs/raw_feature_bc_matrix
- Unfiltered feature-barcode matrices HDF5: /home/jdoe/runs/AGG123/outs/raw_feature_bc_matrix.h5
- Unfiltered molecule-level info:           /home/jdoe/runs/AGG123/outs/raw_molecules.h5
- Barcodes of cell-containing partitions:   /home/jdoe/runs/AGG123/outs/cell_barcodes.csv
- Copy of the input aggregation CSV:        /home/jdoe/runs/AGG123/outs/aggregation.csv
- Loupe Cell Browser file:                  /home/jdoe/runs/AGG123/outs/cloupe.cloupe
定制调整 cellranger reanalyze
相比于count和aggr,reanalyze接受更多的可选的参数,可以说count和aggr中的后续分析只是属于探索性分析,这里的reanalyze才是真正开始接触故事的真相。
$ cellranger reanalyze  -h
cellranger reanalyze (3.0.0)
Copyright (c) 2018 10x Genomics, Inc.  All rights reserved.
-------------------------------------------------------------------------------

'cellranger reanalyze' performs secondary analysis (dimensionality
reduction, clustering and differential expression) on a feature-barcode
matrix generated by the 'cellranger count' or 'cellranger aggr' pipelines.

The analysis takes parameter settings from a CSV file. Please see the following
URL for details on the CSV format:
support.10xgenomics.com/single-cell/software

This pipeline does not support multi-genome samples.

The commands below should be preceded by 'cellranger':

Usage:
    reanalyze
        --id=ID
        --matrix=MATRIX_H5
        [options]
    reanalyze   [options]
    reanalyze -h | --help | --version

Arguments:
    id          A unique run id, used to name output folder [a-zA-Z0-9_-]+.
    matrix      A feature-barcode matrix containing data for one genome. Should
                    be the filtered version, unless using --force-cells.

Options:
# Analysis
    --description=TEXT  Sample description to embed in output files.
    --params=PARAMS_CSV        A CSV file specifying analysis parameters.
                                Optional.
    --barcodes=BARCODE_CSV     A CSV file containing a list of cell barcodes to
                                use for reanalysis, e.g. barcodes exported from
                                Loupe Cell Browser. Optional.
    --genes=GENES_CSV          A CSV file containing a list of feature IDs to
                                   use for reanalysis. For gene expression, this
                                   should correspond to the gene_id field in the
                                   reference GTF should be (e.g. ENSG... for
                                   ENSEMBL-based references).
                                   Optional.
    --exclude-genes=GENES_CSV  A CSV file containing a list of feature IDs to
                                   exclude for reanalysis. For gene expression,
                                   this should correspond to the gene_id field in
                                   the reference GTF (e.g., ENSG... for
                                   ENSEMBL-based references).
                                   The exclusion is applied after --genes.
                                   Optional.
    --agg=AGGREGATION_CSV      If the input matrix was produced by
                                   'cellranger aggr', you may pass the same
                                   aggregation CSV in order to retain
                                   per-library tag information in the
                                   resulting .cloupe file.  This argument is
                                   required to enable chemistry batch correction
                                   Optional.
    --force-cells=NUM          Force pipeline to use this number of cells,
                                   bypassing the cell detection algorithm.
                                   Optional.

# Martian Runtime
    --jobmode=MODE      Job manager to use. Valid options:
                            local (default), sge, lsf, or a .template file
    --localcores=NUM    Set max cores the pipeline may request at one time.
                            Only applies when --jobmode=local.
    --localmem=NUM      Set max GB the pipeline may request at one time.
                            Only applies when --jobmode=local.
    --mempercore=NUM    Set max GB each job may use at one time.
                            Only applies in cluster jobmodes.
    --maxjobs=NUM       Set max jobs submitted to cluster at one time.
                            Only applies in cluster jobmodes.
    --jobinterval=NUM   Set delay between submitting jobs to cluster, in ms.
                            Only applies in cluster jobmodes.
    --overrides=PATH    The path to a JSON file that specifies stage-level
                            overrides for cores and memory.  Finer-grained
                            than --localcores, --mempercore and --localmem.
                            Consult the 10x support website for an example
                            override file.
    --uiport=PORT       Serve web UI at http://localhost:PORT
    --disable-ui        Do not serve the UI.
    --noexit            Keep web UI running after pipestance completes or fails.
    --nopreflight       Skip preflight checks.

    -h --help           Show this message.
    --version           Show version.

Note: 'cellranger reanalyze' can be called in two ways, depending on how you
demultiplexed your BCL data into FASTQ files.

1. If you demultiplexed with 'cellranger mkfastq' or directly with
   Illumina bcl2fastq, then set --fastqs to the project folder containing
   FASTQ files. In addition, set --sample to the name prefixed to the FASTQ
   files comprising your sample. For example, if your FASTQs are named:
       subject1_S1_L001_R1_001.fastq.gz
   then set --sample=subject1

2. If you demultiplexed with 'cellranger demux', then set --fastqs to a
   demux output folder containing FASTQ files. Use the --lanes and --indices
   options to specify which FASTQ reads comprise your sample.
   This method is deprecated. Please use 'cellranger mkfastq' going forward.
$ cd /home/jdoe/runs
$ ls -1 AGG123/outs/*.h5 # verify the input file exists
AGG123/outs/filtered_feature_bc_matrix.h5
AGG123/outs/filtered_molecules.h5
AGG123/outs/raw_feature_bc_matrix.h5
AGG123/outs/raw_molecules.h5
$ cellranger reanalyze --id=AGG123_reanalysis \
--matrix=AGG123/outs/filtered_feature_bc_matrix.h5 \
--params=AGG123_reanalysis.csvOutputs:
- Secondary analysis output CSV: /home/jdoe/runs/AGG123_reanalysis/outs/analysis_csv
- Secondary analysis web summary: /home/jdoe/runs/AGG123_reanalysis/outs/web_summary.html
- Copy of the input parameter CSV: /home/jdoe/runs/AGG123_reanalysis/outs/params_csv.csv
- Copy of the input aggregation CSV: /home/jdoe/runs/AGG123_reanalysis/outs/aggregation_csv.csv
- Loupe Cell Browser file: /home/jdoe/runs/AGG123_reanalysis/outs/cloupe.cloupe数据分析概述
Cell Ranger是由10x genomic公司官方提供的专门用于其单细胞转录组数据分析的软件包。Cell Ranger将前面产生的fastq测序数据比对到参考基因组上,然后进行基因表达定量,生成细胞-基因表达矩阵,并基于此进行细胞聚类和差异表达分析。
比对
基因组比对
Cell Ranger使用star比对软件将reads比对到参考基因组上后使用GTF注释文件进行校正,并区分出外显子区、内含子区、基因间区。
具体的区分规则(mapping QC)为:至少50% 比对到外显子上reads记为外显子区、将比对到非外显子区且与内含子区有交集的reads记为内含子区,除此之外均为基因间区。
MAPQ 校正 对于比对到单个外显子位点但同时比对到1个或多个非外显子位点的reads,对外显子位点进行优先排序,并将reads记为带有MAPQ 255的外显子位点。
转录组比对
Cell Ranger进一步将外显子reads与参考转录本比对,寻找兼容性。注释到单个基因信息的reads认为是一个特异的转录本,只有注释到转录本的reads才用于UMI计数。
参考基因组目录结构 (mkref生成,也可直接从官网下载):
├── fasta
│   └── genome.fa
├── genes
│   └── genes.gtf
├── pickle
│   └── genes.pickle
├── README.BEFORE.MODIFYING
├── reference.json
├── star
│   ├── chrLength.txt
│   ├── chrNameLength.txt
│   ├── chrName.txt
│   ├── chrStart.txt
│   ├── exonGeTrInfo.tab
│   ├── exonInfo.tab
│   ├── geneInfo.tab
│   ├── Genome
│   ├── genomeParameters.txt
│   ├── SA
│   ├── SAindex
│   ├── sjdbInfo.txt
│   ├── sjdbList.fromGTF.out.tab
│   ├── sjdbList.out.tab
│   └── transcriptInfo.tab
└── version
细胞计数(cell QC)
液滴型scRNA-seq方法中只有一小部分的液滴包含珠状物和一个完整细胞。然而生物实验不会那么理想,有些RNA会从死细胞或破损细胞中漏出来。所以没有完整细胞的液滴有可能捕获周围环境游离出的少了RNA并且走完测序环节出现在最终测序结果中。液滴大小、扩增效率和测序环节中的波动会导致”背景”和真实细胞最终获得的文库大小变化很大,使得区分哪些文库来源于背景哪些来源于真实细胞变得复杂。具体见Hemberg-lab单细胞转录组数据分析(四)。
Cell Ranger 3.0引入了一种改进的细胞计数算法,该算法能够更好地识别低RNA含量的细胞群体,特别是当低RNA含量的细胞与高RNA含量的细胞混合时。该算法分为两步:
在第一步中,使用之前的Cell Ranger细胞计数算法识别高RNA含量细胞的主要模式,使用基于每个barcode的UMI总数的cutoff值。Cell Ranger将期望捕获的细胞数量N作为输入(see —expect-cells)。然后将barcodes按照各自的UMI总数由高到低进行排序,取前N个UMI数值的99%分位数为最大估算UMI总数(m),将UMI数目超过m/10的barcodes标记的细胞视为真实细胞。
在第二步中,选择一组具有低UMI计数的barcode,这些barcode可能表示“空的”GEM分区,建立RNA图谱背景模型。利用Simple Good-Turing smoothing平滑算法,对典型空GEM集合中未观测到的基因进行非零模型估计。最后,将第一步中未作为细胞计数的barcode RNA图谱与背景模型进行比较,其RNA谱与背景模型存在较大差异的barcode用于区分包含细胞的barcode和空barcode。
多态率估计(Estimating Multiplet Rates)
当有多个参考基因组(如人H和鼠M)时,Cell Ranger可以通过多基因组分析区分多物种混合建库的样品,主要根据barcode内每个物种对应的UMI数量进行区分,将其分成H和M两类。最后还会根据H,M各自UMI的分布和最大似然估计法估计多细胞比例(multiplet rate),即 (H,M)、(H,H)、(M,M)三种类型的多细胞占比。
基因表达分析(Secondary Analysis of Gene Expression)
尽管我们的表达矩阵经过重重QC,但是单细胞高通量的数据还是表现出高纬度、稀疏性、非正态分布的特点,每一点都是对传统数据分析方法的挑战。于是越来越多的新方法被开发出来,主要借鉴多元分析和机器学习等传统生物统计教材很少教授的方法。越来越多的机器学习方法应用到高通量数据分析中来,那么我们就需要了解机器学习的三个要素;
公式(方法) = 模型 (目的) + 策略(评价) + 算法(实现)
降维分析(Dimensionality Reduction)
流形学习(manifold learning)是机器学习、模式识别中的一种方法,在维数约简方面具有广泛的应用。它的主要思想是将高维的数据映射到低维,使该低维的数据能够反映原高维数据的某些本质结构特征。流形学习的前提是有一种假设,即某些高维数据,实际是一种低维的流形结构嵌入在高维空间中。流形学习的目的是将其映射回低维空间中,揭示其本质。
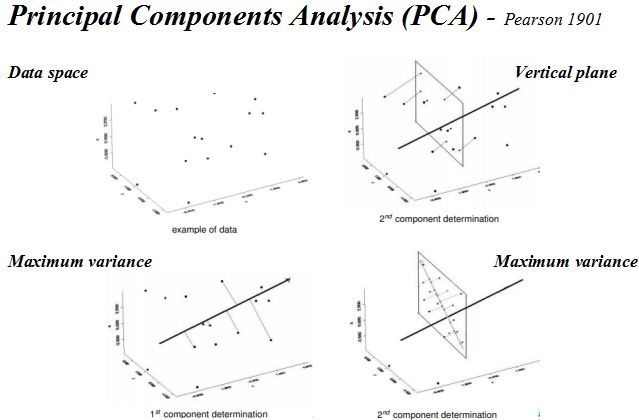
针对单细胞测速数据特点,一般为了提取基因表达矩阵最重要的特征采用降维分析将多维数据的差异投影在低维度上,进而揭示复杂数据背后的规律。Cell Ranger先采用基于IRLBA算法的主成分分析(Principal Components Analysis,PCA))将数据集的维数从(Cell x genes)改变为(Cell x M,M是主成分数量)。然后采用非线性降维算法t-SNE)将降维后的数据展示在2维或三维空间中,细胞之间的基因表达模式越相似,在t-SNE图中的距离也越接近。
聚类分析(Clustering)
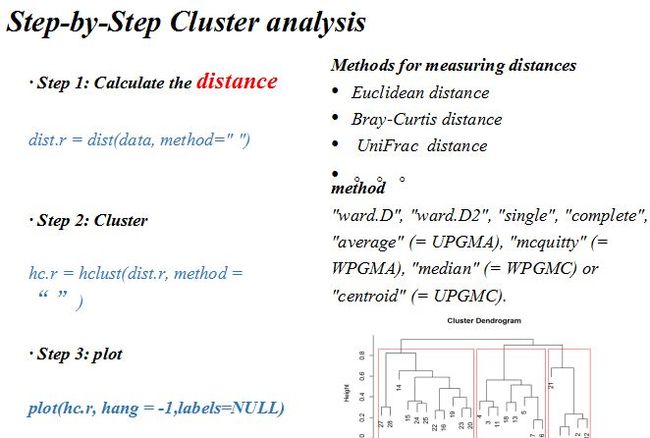
聚类是把相似的对象通过静态分类的方法分成不同的组别或者更多的不连续子集(subset),这样让在同一个子集中的成员对象都有相似的一些属性。在单细胞研究中,聚类分析是识别细胞异质性(heterogeneity)常用的算法。
在PCA空间中,Cell Ranger分别采用Graph-based和K-Means两种不同的聚类方法对细胞进行聚类:
Graph-based
图聚类算法包括两步:首先用PCA降维的数据构建一个细胞间的k近邻稀疏矩阵,即将一个细胞与其欧式距离上最近的k个细胞聚为一类,然后在此基础上用Louvain算法进行模块优化 (Blondel, Guillaume, Lambiotte, & Lefebvre, 2008),旨在找到图中高度连接的模块。最后通过层次聚类将位于同一区域内没有差异表达基因(B-H adjusted p-value 低于0.05)的cluster进一步融合,重复该过程直到没有clusters可以合并。
k-means
K-Means聚类是无监督的机器学习算法。在PCA降维的空间中随机选取的k个初始质心点,将每个点划分到最近的质心,形成K个簇 ,然后对于每一个cluster重新计算质心并再次进行划分,重复该过程直到收敛。与图聚类算法的k意义不同,这里的k是事先给定的亚群数目。
差异分析(Differential Expression)
为了找到不同细胞亚群之间的差异基因,Cell Ranger使用改进的sSeq方法(基于负二项检验; Yu, Huber, & Vitek, 2013)。当UMI counts数值较大时,为加快分析速度,Cell Ranger会自动切换到edgeR进行beta检验(Robinson & Smyth, 2007)。通过样品的一个亚群与该样品的所有其他亚群进行比较,得到该亚群细胞与其他亚群细胞之间的差异基因列表。
Cell Ranger’s implementation differs slightly from that in the paper: in the sSeq paper, the authors recommend using DESeq’s geometric mean-based definition of library size. Cell Ranger instead computes relative library size as the total UMI counts for each cell divided by the median UMI counts per cell. As with sSeq, normalization is implicit in that the per-cell library-size parameter is incorporated as a factor in the exact-test probability calculations.
化学批次校正(Chemistry Batch Correction)
为了校正V2V3化学试剂之间的批次效应,Cell Ranger采用一种基于mutual nearest neighbors (MNN; (Haghverdi et al, 2018)的算法来识别批次之间的相似细胞亚群。MNN定义为来自彼此最近邻集合中包含的两个不同批次的细胞群。使用批次之间匹配的细胞亚群,将多个批次合并在一起(Hie et al, 2018)。MNN对中细胞间表达值的差异提供了批次效应的估计。每个细胞校正向量的加权平均值用来估计批次效应。
批次效应得分(batch effect score )被定义为定量测量校正前后的批次效应。对于每个细胞,计算其k个最近的细胞(nearest-neighbors)中有m个属于同一批次,并在没有批次效应时将其标准化为相同批次细胞的期望值M。批次效应得分计算为随机抽取10%的细胞总数S中的上述度量的平均值。如果没有批次效应,我们可以预期每个单元格的最近邻居将在所有批次中均匀共享,批次效应得分接近1。
最近单细胞的小伙伴都在看的一篇文章,不知道你看了没:单细胞测序(scRNA-seq)数据处理必知必会:
Hemberg-lab单细胞转录组数据分析(一)
Hemberg-lab单细胞转录组数据分析(二)
Hemberg-lab单细胞转录组数据分析(三)
Hemberg-lab单细胞转录组数据分析(四)
Hemberg-lab单细胞转录组数据分析(五)
Hemberg-lab单细胞转录组数据分析(六)
Hemberg-lab单细胞转录组数据分析(七)-导入10X和SmartSeq2数据Tabula Muris
Hemberg-lab单细胞转录组数据分析(八)- Scater包输入导入和存储
Hemberg-lab单细胞转录组数据分析(九)- Scater包单细胞过滤
收藏|北大生信平台"单细胞分析、染色质分析"视频和PPT分享
该如何自学入门生物信息学
生物信息之程序学习
收藏|你想要的生信学习系列教程-宝典在手,生信无忧
全文完,点击阅读原文跳转作者简书,有更多参考文章。cellranger-3.0.0/cellranger-cs/3.0.0/bin
cellranger (3.0.0)
Copyright (c) 2018 10x Genomics, Inc. All rights reserved.
-------------------------------------------------------------------------------
Usage:
cellranger mkfastq
cellranger count
cellranger aggr
cellranger reanalyze
cellranger mat2csv
cellranger mkgtf
cellranger mkref
cellranger vdj
cellranger mkvdjref
cellranger testrun
cellranger upload
cellranger sitecheck更多阅读
画图三字经 生信视频 生信系列教程
心得体会 TCGA数据库 Linux Python
高通量分析 免费在线画图 测序历史 超级增强子
生信学习视频 PPT EXCEL 文章写作 ggplot2
海哥组学 可视化套路 基因组浏览器
色彩搭配 图形排版 互作网络
自学生信
![]()
![]()
后台回复“生信宝典福利第一波”获取教程合集
听说分享到朋友圈的朋友会在公众号周年庆时中奖 (大家还记得去年的大放送吧,不记得查查历史![]() )
)


