MATLAB图形加标注的基本方法入门简介
一、引言
Matlab绘图时,为了让图形窗口中的图元看着清晰明了,往往需要增加一写标注,例如“标题”、“图例”、“图元符号表示”、“坐标轴标签”等,本文针对上述标注方法逐一进行举例说明。
二、为图形添加标题
函数及语法:
title( ‘字符串’, ‘属性名’, 属性值, … )
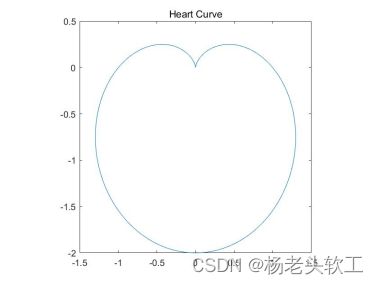
例1:绘制心形曲线,并加标题
theta = [ 0 : 0.01 : 2 ] * pi;
x = ( 1 - cos(theta)) .* cos(theta);
y = ( 1 - cos(theta)) .* sin(theta);
rotationM = [ 0, -1; 1, 0 ];
A = rotationM * [ x; y ];%逆时针旋转90°
x = A( 1, : );
y = A( 2, : );
plot( x, y )
axis square
title( 'Heart Curve' )
三、为图形添加图例
函数及语法:
legend( 字符串1, 字符串2, 字符串3,…, 位置pos )
pos的取值为
0自动把图例放到最佳位置,即和曲线重复最少的位置;
1至于图形的右上角;(此为缺省值)
2至于图形的左上角;
3至于图形的左下角;
4至于图形的右下角;
-1,至于图形的右侧外部。
注意:不同的版本,pos的用法法可能不同,需要注意,例如通过使用属性“Location”的值来确定位置,取值有19种之多。
代码如下:
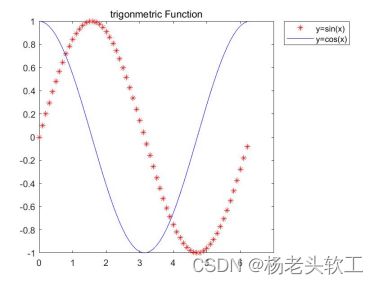
例2:在一个图形窗口绘制正弦曲线和余弦曲线,并添加图例
代码如下:
x=0:0.1:2*pi;
plot(x,sin(x),'*r');
hold on;plot(x,cos(x),'-b');
legend('y=sin(x)','y=cos(x)',-1 )
%legend('y=sin(x)','y=cos(x)','Location', 'northeastoutside' )
title('trigonmetric Function');
四、为图形添加坐标轴标签
函数及语法:
xlabel( ‘x’ )%x轴标签
ylabel( ‘y’ )%y轴标签
zlabel( ‘z’ )%z轴标签,三维图形使用
也有更复杂的参数,详解下面例4.
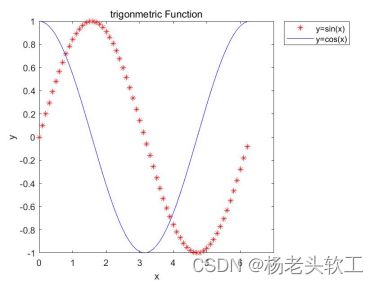
例3:在一个图形窗口绘制正弦曲线和余弦曲线,并添加图例、标题
代码如下:
x=0:0.1:2*pi;
plot(x,sin(x),'*r');
hold on;plot(x,cos(x),'-b');
%legend('y=sin(x)','y=cos(x)',-1 )
legend('y=sin(x)','y=cos(x)','Location', 'northeastoutside' )
xlabel( 'x' )
ylabel( 'y' )
title('trigonmetric Function');
t=linspace(0,10*pi,501);
plot3(sin(t),cos(t),t)
xlabel('sin(t)','FontWeight','bold','fontAngle','italic');
ylabel('cos(t)','FontWeight','bold','fontAngle','italic');
zlabel('t','FontWeight','bold','fontAngle','italic');
运行结果:
五、为图形添加图元标识
text(x,y,’string’) 在图形的指定位置(x,y)增加标注string
gtext(‘string’) 在现有图上用鼠标放置标注
1)在图形窗口中增加字符串
例5:在一个图形窗口绘制正弦曲线和余弦曲线,并添加图元的标注
代码如下:
x=linspace(0,2*pi,30);
y=sin(x);
plot(x,y)
xlabel('自变量 X')
ylabel('函数 Y')
title('text与gtext示意图')
text(3.5,0.63,'y=sin(x)')
annotation('arrow',[0.5 0.42],[0.75 0.72],'LineStyle','-','color',[0 0 1]);
hold on
plot( x, cos(x), 'r' )
gtext('y=cos(x)')
运行结果:

2)在图形窗口中增加数值型数据,例如增加坐标点
例6:利用模拟退火算法求函数
![]()
的极小值。
代码如下:
clear all
clc
fun = @(x)x.^2 + 2*sin(3*x);%生成符号函数
x0 = 0;
lb = [];
ub = [];
opts = [];
[x, feval] = simulannealbnd( fun, x0, lb, ub, opts )%模拟退火求最优值
figure;
fplot( fun ); %fplot可以直接对符号函数fun进行绘图
hold on
plot( x, feval, 'ro');
axisVec = [ '(', num2str(x), ' , ', num2str(feval), ')' ];%生成坐标点的字符串
text( x-1, feval-2, axisVec ); %在指定的坐标位置显示字符串数据
axis( [-5, 5, -5, 30] )
grid on


