概率统计笔记:用python实现贝叶斯回归
0 理论部分:
概率统计笔记:贝叶斯线性回归_UQI-LIUWJ的博客-CSDN博客
1 数据集部分
1.1 创建数据集
import matplotlib.pyplot as plt

a_true = 2
b_true = 1
tau_true = 1

n = 50
x = np.random.uniform(low = 0, high = 4, size = n)
y = np.random.normal(a_true * x + b_true, 1 / np.sqrt(tau_true))![]() (均匀分布)
(均匀分布)
y ~ N(2x+1,1) (正态分布)
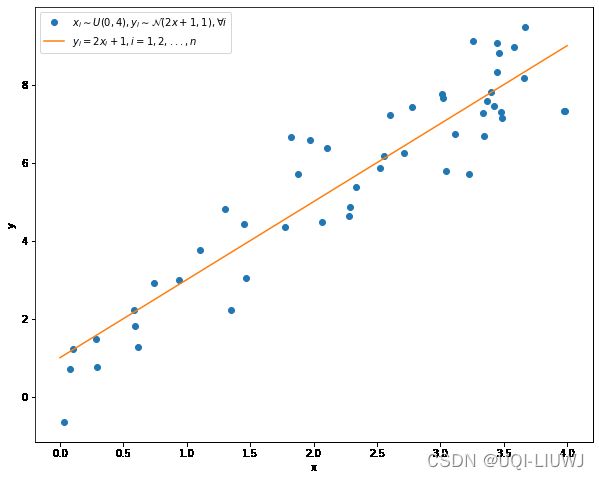
1.2 数据集可视化
fig = plt.figure(figsize = (10, 8))
ax = plt.subplot(111)
plt.plot(x, y, "o", label =r"$x_i\sim U\left(0,4\right),y_i\sim\mathcal{N}\left(2x+1,1\right),\forall i$")
#输入数据
plt.xlabel('x')
plt.ylabel('y')
plt.plot([0, 4], [1, 9], label = r"$y_i=2x_i+1,i=1,2,...,n$")
#欲拟合数据
ax.legend()
2 参数&超参数初始化:
maxiter = 1000
init = {"a": 0, "b": 0, "tau_epsilon": 2}
hypers = {"mu_1": 0, "tau_1": 1, "mu_2": 0, "tau_2": 1, "alpha": 2, "beta": 1}
3 采样
3.1 采样a
import numpy as np

def sample_para_a(x, y, b, tau_epsilon, mu_1, tau_1):
    n = len(y)

    tilde_tau_1 = tau_1 + tau_epsilon * np.sum(x * x)
    #γ1+τε Σx_i^2

    tilde_mu_1 = tau_1 * mu_1 + tau_epsilon * np.sum((y - b) * x)
    #μ1γ1+τε Σ(y_i-b)x_i

    tilde_mu_1 /= tilde_tau_1

    return np.random.normal(tilde_mu_1, 1./np.sqrt(tilde_tau_1))
3.2 采样b
def sample_para_b(x, y, a, tau_epsilon, mu_2, tau_2):
    n = len(y)

    tilde_tau_2 = tau_2 + n * tau_epsilon
    #γ2+nτε

    tilde_mu_2 = tau_2 * mu_2 + tau_epsilon * np.sum(y - a * x)
    #μ2γ2+τε Σ(y_i-ax_i)

    tilde_mu_2 /= tilde_tau_2
    return np.random.normal(tilde_mu_2, 1./np.sqrt(tilde_tau_2))
3.3 采样 τε
def sample_tau_epsilon(x, y, a, b, alpha, beta):
    n = len(y)
    tilde_alpha = alpha + n / 2
    #α+n/2

    tilde_beta = beta + np.sum((y - a * x - b) * (y - a * x - b)) / 2
    #β+(Σ(y_i-ax_i-b)^2)/2

    return np.random.gamma(tilde_alpha, 1 / tilde_beta)
3.4 吉布斯采样
MCMC笔记:吉布斯采样(Gibbs)_UQI-LIUWJ的博客-CSDN博客
import pandas as pd

def gibbs(x, y, maxiter, init, hypers):

    a = init["a"]
    b = init["b"]
    tau_epsilon = init["tau_epsilon"]

    trace = np.zeros((maxiter+1, 3))
    trace[0:]=np.array((a, b, tau_epsilon))

    for iter in range(maxiter):
        a = sample_para_a(x, y, b, tau_epsilon, hypers["mu_1"], hypers["tau_1"])
        #用b_(t-1)  τε_(t-1) 采样 a_t

        b = sample_para_b(x, y, a, tau_epsilon, hypers["mu_2"], hypers["tau_2"])
        #用a_t τε_(t-1) 采样 b_t

        tau_epsilon = sample_tau_epsilon(x, y, a, b, hypers["alpha"], hypers["beta"])
        #用a_t b_t 采样 τε_t

        trace[iter+1, :] = np.array((a, b, tau_epsilon))
        #保存这一次迭代的信息

    trace = pd.DataFrame(trace)
    trace.columns = ['a', 'b', 'tau_epsilon']
    return trace
#返回一个pd  DataFrame
4 训练+可视化trace
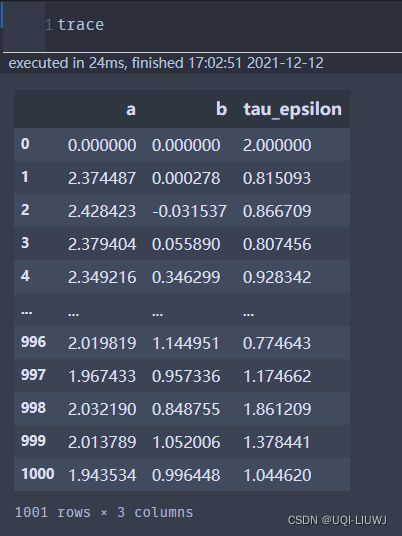
trace = gibbs(x, y, maxiter, init, hypers)


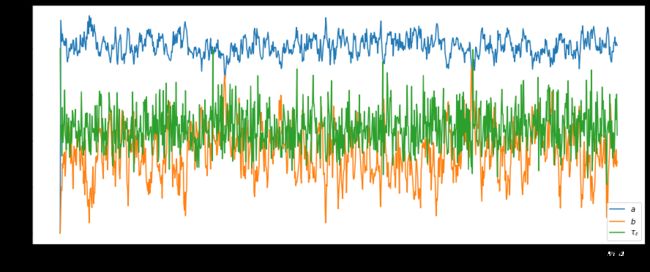
#下面是可视化部分
fig = plt.figure(figsize = (10, 6))
plt.plot(trace['a'], label = r"$a$")
plt.plot(trace['b'], label = r"$b$")
plt.plot(trace['tau_epsilon'], label = r"$\tau_{\epsilon}$")
plt.xlabel("Iterations")
plt.ylabel("Parameter Value")
plt.legend()
参考资料:浅谈贝叶斯张量分解(二):简单的贝叶斯线性回归模型 - 知乎 (zhihu.com)


