基于机器学习的量化投资策略
背景
tushare ID=399224
机器学习已经广泛地应用在数据挖掘、计算机视觉、生物特征识别、证券市场分析和DNA序列测序等领域。机器学习算法可以分为有监督学习,无监督学习,强化学习3种类型。在有监督学习中,最早可以追溯到1936年Fisher发明的线性判别分析,在当时还没有机器学习的概念,其后出现贝叶斯分类器、logistic回归、KNN算法等零碎化的机器学习算法,不成体系,直至1980年开始,机器学习才成为一个独立的研究方向。在1995年则诞生了两种经典的算法-SVM和AdaBoot,由于支持向量机方法是建立在统计学习理论的VC维理论和结构风险最小原理基础上的,根据有限的样本信息在模型的复杂性和学习能力之间寻求最平衡的点,以获得最好的推广能力,主要有可解决小样本情况下单机器学习问题、可解决高维问题、可解决非线性问题等。
下面基于python使用sklearn对比亚迪进行股票涨跌预测
数据来源于tushare
下面使用python进行建模
数据来自tushare平台
如果没有账号点击此处创建:https://tushare.pro/register?reg=399224
导入工具包
#!/usr/bin/env python

#coding=utf-8
import pandas as pd
from pandas.io.parsers import read_csv
from sklearn import svm,preprocessing
import matplotlib.pyplot as plt
import tushare as ts
import matplotlib
import numpy as np
from matplotlib.pyplot import MultipleLocator
from sklearn.tree import DecisionTreeClassifier
from sklearn.linear_model import LogisticRegression
from sklearn.preprocessing import StandardScaler
from sklearn.svm import LinearSVC
from sklearn.pipeline import make_pipeline
from sklearn.ensemble import RandomForestClassifier
from sklearn.ensemble import GradientBoostingClassifier
from sklearn.model_selection import GridSearchCV
from sklearn.utils._testing import ignore_warnings
from sklearn.exceptions import ConvergenceWarning
接下来从tushare导入数据以及设置图像中文
matplotlib.rcParams['axes.unicode_minus']=False
plt.rcParams['font.sans-serif']=['SimHei']

ts.set_token('your token')#输入你的token
pro = ts.pro_api()
list_ans=[]

code='002594.SZ'#可选择其他股票
data=pro.daily(ts_code=code, start_date='20200701', end_date='20210926')
for i in range(0,data.shape[0]):
    # print(data.loc[i,"trade_date"])#20200727
    data.loc[i,"trade_date"]=(data.loc[i,"trade_date"])[0:4]+"-"+(data.loc[i,"trade_date"])[4:6]+"-"+(data.loc[i,"trade_date"])[6:]
data['data']=pd.to_datetime(data.trade_date,format='%Y-%m-%d')
origDf=data.sort_values(by='data')
origDf.reset_index(drop=True, inplace=True)
清洗数据以及选择特征向量
df=origDf[['close','high', 'low','open','vol','trade_date']]
#diff列表示本日和上日收盘价的差
df['diff'] = df["close"]-df["close"].shift(1)
df['diff'].fillna(0, inplace = True)

for i in range(0,df.shape[0]):
    if df['diff'][i]>0:
        df.loc[i,'up']=1
    else:
        df.loc[i,'up']=0

target = df['up']
length=len(df)

trainNum=int(length*0.8)
predictNum=length-trainNum
    #选择指定列作为特征列
feature=df[['close','high','low','open','vol']]
    #标准化处理特征值
feature=preprocessing.scale(feature)
    #训练集的特征值和目标值

featureTrain=feature[1:trainNum-1]
targetTrain=target[1:trainNum-1]
设置分类器
def get_name(estimator):
    name = estimator.__class__.__name__
    if name == 'Pipeline':
        name = [get_name(est[1]) for est in estimator.steps]
        name = ' + '.join(name)
    return name

classifiers = [
    (DecisionTreeClassifier(random_state=0), {#决策树
    }),
    (LogisticRegression(random_state=0), {#逻辑回归
        'C': np.logspace(-2, 7, 10)
    }),
    (make_pipeline(StandardScaler(), LinearSVC(random_state=0, tol=1e-5)), {
            'linearsvc__C': np.logspace(-2, 7, 10)
        }),#SVM
    (RandomForestClassifier(n_estimators=10),{}),
    (GradientBoostingClassifier(n_estimators=50, random_state=0), {
        'learning_rate': np.logspace(-4, 0, 10)
    })
]
训练模型
names = [get_name(e) for e, g in classifiers]
for est_idx, (name, (estimator, param_grid)) in enumerate(zip(names, classifiers)):


    MachineLearning_Tool = GridSearchCV(estimator=estimator, param_grid=param_grid)
    with ignore_warnings(category=ConvergenceWarning):
        MachineLearning_Tool.fit(featureTrain,targetTrain)

        predictedIndex=trainNum

            #逐行预测测试集

        while predictedIndex<length:
            testFeature=feature[predictedIndex:predictedIndex+1]
            predictForUp=MachineLearning_Tool.predict(testFeature)
            df.loc[predictedIndex,'predictForUp']=predictForUp
            predictedIndex = predictedIndex+1
            #该对象只包含预测数据,即只包含测试集

        dfWithPredicted = df.loc[trainNum:length,]
        pre=list(dfWithPredicted['predictForUp'])
        act=list(dfWithPredicted['up'])
        K=0
        for i in range(0,dfWithPredicted.shape[0]):
            if pre[i]==act[i]:
                K=K+1
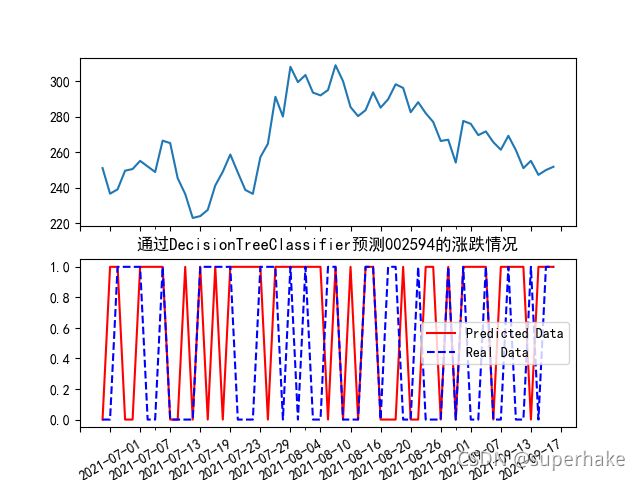
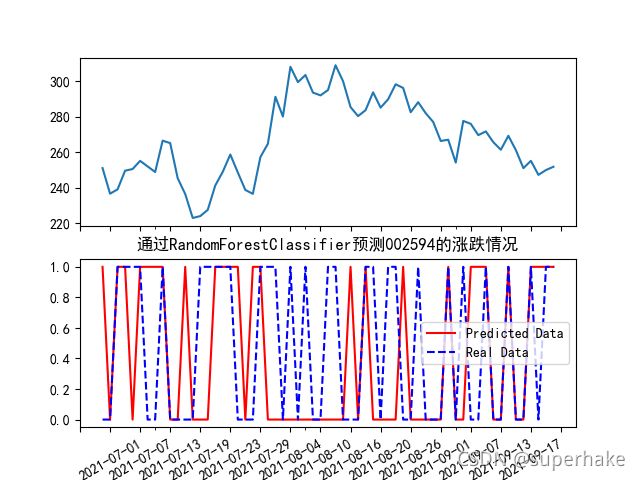
            #开始绘图,创建两个子图
        figure = plt.figure()
            #创建子图
        (axclose, axUpOrDown) = figure.subplots(2, sharex=True)
        dfWithPredicted['close'].plot(ax=axclose)
        dfWithPredicted['predictForUp'].plot(ax=axUpOrDown,color="red", label='Predicted Data')
        dfWithPredicted['up'].plot(ax=axUpOrDown,color="blue",label='Real Data',linestyle="--" )
        plt.legend(loc='best') #绘制图例
            #设置x轴坐标标签和旋转角度
        major_index=dfWithPredicted.index[dfWithPredicted.index%2==0]
        major_xtics=dfWithPredicted['trade_date'][dfWithPredicted.index%2==0]
        plt.xticks(major_index,major_xtics)

        plt.setp(plt.gca().get_xticklabels(), rotation=30)
        plt.title("通过"+name+"预测"+code[0:6]+"的涨跌情况")
        plt.rcParams['font.sans-serif']=['SimHei']
        x_major_locator=MultipleLocator(4)
        plt.gca().xaxis.set_major_locator(x_major_locator)
        #plt.savefig(name+code[0:6]+".png",figsize=[10,10])
        plt.show()


