【Python数据可视化(六)】用图像和地图绘制图表
用PIL做图像处理
PIL坐标系统假定坐标(0,0)位于左上角。Image模块有一个非常有用的类和一些实例方法来对加载的图像对象(im)执行基本的操作。
| im=Image.open(filename) | 打开一个文件,并把图像加载到im对象上 |
| im.crop(box) | 裁剪box.box定义在左、上、右、下像素坐标(例如box=(0,100,100,100))指定的坐标区域内的图像 |
| im.filter(filter) | 为图像应用一个滤波器,并返回滤波后的图像 |
| im.histogram() | 返回该图像的直方图列表,其中的每一个元素代表像素值。对于单通道图像,列表中的元素数目为256,但是如果图像不是单通道图像,列表中会包含更多的元素。对于RGB图像,列表包含768个元素(每个通道有256个值) |
| im.resize(size,filter) | 重新调整图像大小,并且使用一个滤波器进行重新采样(resampling)。可能的滤波器有NEAREST,BILINEAR,BICUBIC和ANTIALIAS。默认值为NEAREST。 |
| im.rotate(angle,filter) | 逆时针方向旋转图像 |
| im.split() | 分离图像波段(band)并返回一个单一波段的元组。这对于分离一个RGB图像为3个单独的波段图像非常有用 |
| im.transform(size,method,data,filter) | 用data和filter对一个给定的图像做转换,转换类型可以是AFFINE、EXTENT、QUAD、和MESH |
| ImageChops.duplicate(image) | 拷贝当前图像到一个新的图像对象 |
| ImageChops.invert(image) | 反转一幅图像并返回一个副本 |
| ImageChops.difference(image1,image2) | 在不用目测的情况下验证两幅图是否相同时非常有用 |
绘制带图像的图表
import matplotlib.pyplot as plt
import matplotlib.image as im
from matplotlib.offsetbox import TextArea, OffsetImage, AnnotationBbox
def load_data():
import csv
with open('pirates_temperature.csv', 'r') as f:
reader = csv.reader(f)
header = next(reader)
datarows = []
for row in reader:
datarows.append(row)
return header, datarows
def format_data(datarows):
years, temps, pirates = [], [], []
for each in datarows:
years.append(each[0])
temps.append(each[1])
pirates.append(each[2])
return years, temps, pirates
if __name__ == '__main__':
fig = plt.figure(figsize=(16, 8))
ax = plt.subplot(111)
header, datarows = load_data()
xlabel, ylabel= header[0], header[1]
years, temperature, pirates = format_data(datarows)
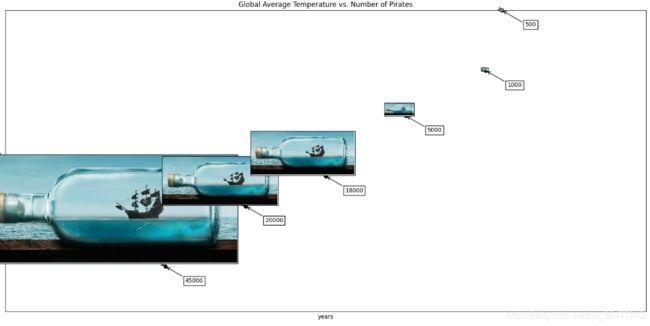
title = "Global Average Temperature vs. Number of Pirates"
plt.plot(years, temperature,lw=2)
plt.xlabel(xlabel)
plt.ylabel(ylabel)
# 为每个数据点标注图像和数字
for x in range(len(years)):
xy = int(years[x]), float(temperature[x])
print(xy)
ax.plot(xy[0], xy[1],'ok')
pirate = im.imread('ship.png',0)
# 随大小移动图像
zoomc = int(pirates[x]) * (1 / 90000.)
imagebox = OffsetImage(pirate, zoom=zoomc)
ab = AnnotationBbox(imagebox, xy,
xybox=(-200. * zoomc, 200. * zoomc),
xycoords='data',
boxcoords='offset points',
pad=0.1,
arrowprops=dict(arrowstyle='->', connectionstyle='angle,angleA=0,angleB=-30,rad=3')
)
ax.add_artist(ab)
no_pirates = TextArea(pirates[x], minimumdescent=False)
ab = AnnotationBbox(no_pirates, xy,
xybox=(50., -25.),
xycoords='data',
boxcoords='offset points',
pad=0.3,
arrowprops=dict(arrowstyle='->', connectionstyle='angle,angleA=0,angleB=-30,rad=3')
)
ax.add_artist(ab)
plt.grid(1)
plt.xlim(1700, 2100)
plt.ylim(14, 16)
plt.title(title)
plt.show()
补充说明:
> > > > > >
AnnotationBbox是一个像注解一样的类,但是它能显示其他的OffsetBox实例,而不是像Axes.annotate函数那样只显示文本,这允许我们在注解中加载一幅图或者文本对象,并把它放置在与数据点有一定距离的地方,也可以使用箭头功能(arrowprops)精确地指向一个被注解的数据点。
Imagebox 必须是一个OffsetBox实例,它是注解框的内容 xy 与注解关联的数据点坐标 xybox 指定注解框的位置 xycoords 指定xy使用的坐标系统 boxcoords 指定xybox使用的坐标系统 pad 指定内边距(padding)的数量 arrowprops 用于绘制注解边框与数据点的连接箭头的属性字典
在具有其他图形的图表中显示图像
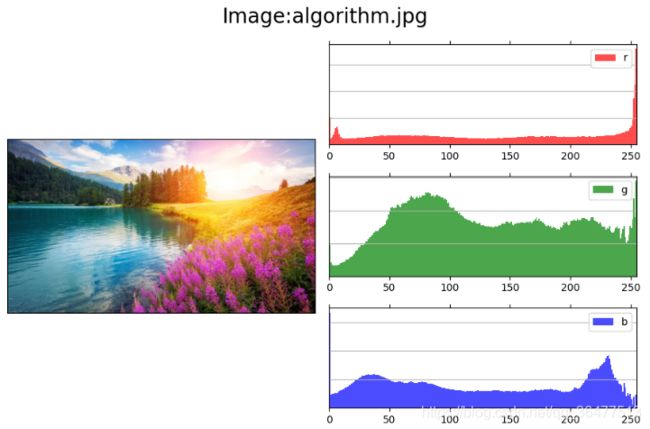
使用Python matplotlib库来处理图像通道,并显示外部图像的单通道直方图,显示红绿蓝三个通道的图像直方图。
import matplotlib.pyplot as plt
import matplotlib.image as mpliamge
import matplotlib as mpl
import os


class ImageViewer(object):
    # 加载图像
    def __init__(self, imfile):
        self._load_image(imfile)
        self._configure()
        self.figure = plt.gcf()
        t = 'Image:{0}'.format(os.path.basename(imfile))
        self.figure.suptitle(t, fontsize=20)
        self.shape = (3, 2)

    def _configure(self):
        mpl.rcParams['font.size'] = 10
        mpl.rcParams['figure.autolayout'] = False
        mpl.rcParams['figure.figsize'] = (9, 6)
        mpl.rcParams['figure.subplot.top'] = .9

    def _load_image(self, imfile):
        self.im = mpliamge.imread(imfile)
    # 从图像矩阵中分离出RGB通道
    @staticmethod
    def _get_chno(ch):
        chmap = {'r': 0, 'g': 1, 'b': 2}
        return chmap.get(ch, -1)
    # 配置图表和坐标轴(子区)
    def show_channel(self, ch):
        bins = 256
        ec = 'none'
        chno = self._get_chno(ch)
        loc = (chno, 1)
        ax = plt.subplot2grid(self.shape, loc)
        ax.hist(self.im[:, :, chno].flatten(), bins, color=ch, ec=ec,
                label=ch, alpha=.7)
        ax.set_xlim(0, 255)
        plt.setp(ax.get_xticklabels(), visible=True)
        plt.setp(ax.get_yticklabels(), visible=False)
        plt.setp(ax.get_xticklines(), visible=True)
        plt.setp(ax.get_yticklines(), visible=False)
        plt.legend()
        plt.grid(True, axis='y')
        return ax
    # 绘制通道直方图
    def show(self):
        loc = (0, 0)
        axim = plt.subplot2grid(self.shape, loc, rowspan=3)
        axim.imshow(self.im)
        plt.setp(axim.get_xticklabels(), visible=False)
        plt.setp(axim.get_yticklabels(), visible=False)
        plt.setp(axim.get_xticklines(), visible=False)
        plt.setp(axim.get_yticklines(), visible=False)
        axr = self.show_channel('r')
        axg = self.show_channel('g')
        axb = self.show_channel('b')
        plt.show()


if __name__ == '__main__':
    im = 'algorithm.jpg'
    try:
        iv = ImageViewer(im)
        iv.show()
    except Exception as ex:
        print(ex)
使用Basemap在地图上绘制数据
Base本身不进行任何绘图的工作,它只是把给定的地理坐标转换到地图投影,并把数据传给matplotlib进行绘图。
from mpl_toolkits.basemap import Basemap
import numpy as np
import matplotlib.pyplot as plt

# 墨卡托(mercator)投影,实例化Basemap,并指定左下角和右上角的经纬度
map = Basemap(projection='merc', resolution='h', area_thresh=0.1,
              # USA
              # llcrnrlon=-126.619875, llcrnrlat=31.354158,
              # urcrnrlon=-59.647219, urcrnrlat=47.517613
              # CN
              llcrnrlon=69.67111, llcrnrlat=0.875111,
              urcrnrlon=136.342914, urcrnrlat=55.23032
              )
# 绘制海岸线和国家
map.drawcoastlines()
map.drawcountries()
# 填充并绘制地图边界
map.fillcontinents(color='coral', lake_color='aqua')
map.drawmapboundary(fill_color='aqua')
# 绘制子午线和平行线
map.drawmeridians(np.arange(0, 360, 30))
map.drawparallels(np.arange(-90, 90, 30))
plt.show()

将cities.shp和cities.shx文件加载美国城市的坐标并把它们投影到地图上。
from mpl_toolkits.basemap import Basemap
import matplotlib.pyplot as plt
import numpy as np

map = Basemap(projection='merc',
              resolution='h',
              area_thresh=100,
              llcrnrlon=-126.619875, llcrnrlat=25,
              urcrnrlon=-59.647219, urcrnrlat=55)

shapeinfo = map.readshapefile('cities', 'cities')

x, y = zip(*map.cities)

# build a list of US cities
city_names = []
for each in map.cities_info:
    if each['COUNTRY'] != 'US':
        city_names.append("")
    else:
        city_names.append(each['NAME'])

map.drawcoastlines()
map.drawcountries()
map.fillcontinents(color='coral', lake_color='aqua')
map.drawmapboundary(fill_color='aqua')
map.drawmeridians(np.arange(0, 360, 30))
map.drawparallels(np.arange(-90, 90, 30))

# draw city markers
map.scatter(x, y, 25, marker='o', zorder=10)

# plot labels at City coords.
for city_label, city_x, city_y in zip(city_names, x, y):
    plt.text(city_x, city_y, city_label)

plt.title('Cities in USA')

plt.show()
使用Google Map API在地图上绘制数据
import csv
import gviz_api
def get_page_template():
"""
实现一个模板生成器
:return:
"""
page_template = """
Median Monthly Disposable Salary World Countries
"""
return page_template
def main():
# 从本地CSV文件加载数据
afile = "median-dpi-countries.csv"
datarows = []
with open(afile, 'r') as f:
reader = csv.reader(f)
header = next(reader) # skip header
for row in reader:
datarows.append(row)
# 描述数据
description = {"country": ("string", "Country"),
"dpi": ("number", "EUR"), }
# 使用LoadData从Python字典中加载数据
data = []
for each in datarows:
data.append({"country": each[0],
"dpi": (float(each[1]), each[1])})
data_table = gviz_api.DataTable(description)
data_table.LoadData(data)
json = data_table.ToJSon(columns_order=("country", "dpi"),
order_by="country", )
# 把输出渲染到Web页面
with open('output.html', 'w') as out:
out.write(get_page_template() % (json,))
if __name__ == '__main__':
main()
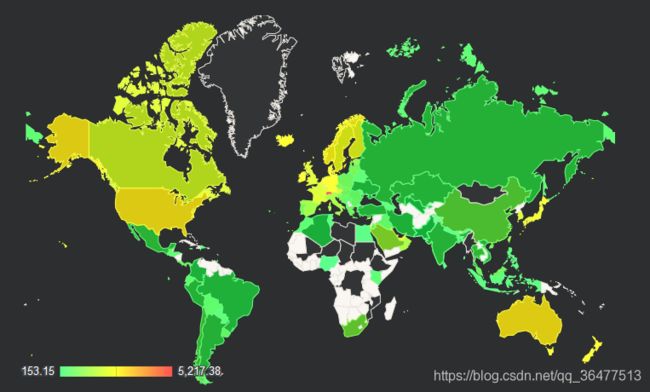
补充说明:
使用用于Python的Google数据可视化库来为前台界面准备数据,并使用另一个Google可视化API在要求的可视化平台,也就是在地图和表格中渲染数据。
生成CAPTCHA图像
from PIL import Image, ImageDraw, ImageFont
import random
import string


class SimpleCaptchaException(Exception):
    pass


class SimpleCaptcha(object):
    # 设置图像大小、文本、字体大小、背景颜色和CAPTCHA长度
    def __init__(self, length=5, size=(200, 100), fontsize=36,
                 random_text=None, random_bgcolor=None):
        self.size = size
        self.text = "CAPTCHA"
        self.fontsize = fontsize
        self.bgcolor = 255
        self.length = length

        self.image = None  # current captcha image

        if random_text:
            self.text = self._random_text()

        if not self.text:
            raise SimpleCaptchaException("Field text must not be empty.")

        if not self.size:
            raise SimpleCaptchaException("Size must not be empty.")

        if not self.fontsize:
            raise SimpleCaptchaException("Font size must be defined.")

        if random_bgcolor:
            self.bgcolor = self._random_color()

    def _center_coords(self, draw, font):
        width, height = draw.textsize(self.text, font)
        xy = (self.size[0] - width) / 2., (self.size[1] - height) / 2.
        return xy

    def _add_noise_dots(self, draw):
        size = self.image.size
        for _ in range(int(size[0] * size[1] * 0.1)):
            draw.point((random.randint(0, size[0]),
                        random.randint(0, size[1])),
                        fill="white")
        return draw

    def _add_noise_lines(self, draw):
        size = self.image.size
        for _ in range(8):
            width = random.randint(1, 2)
            start = (0, random.randint(0, size[1] - 1))
            end = (size[0], random.randint(0, size[1] - 1))
            draw.line([start, end], fill="white", width=width)
        for _ in range(8):
            start = (-50, -50)
            end = (size[0] + 10, random.randint(0, size[1] + 10))
            draw.arc(start + end, 0, 360, fill="white")
        return draw
    # 把生成的图像返回给调用者
    def get_captcha(self, size=None, text=None, bgcolor=None):
        if text is not None:
            self.text = text
        if size is not None:
            self.size = size
        if bgcolor is not None:
            self.bgcolor = bgcolor

        self.image = Image.new('RGB', self.size, self.bgcolor)
        font = ImageFont.truetype('fonts/Vera.ttf', self.fontsize)
        draw = ImageDraw.Draw(self.image)
        # 从英文字母表中选取随机的字符,并用指定的字体和颜色在图像中把这些字符绘制出来
        xy = self._center_coords(draw, font)
        draw.text(xy=xy, text=self.text, font=font)

        # 添加一些直线和弧线形式的噪声
        draw = self._add_noise_dots(draw)

        draw = self._add_noise_lines(draw)

        self.image.show()
        return self.image, self.text

    def _random_text(self):
        letters = string.ascii_lowercase + string.ascii_uppercase
        random_text = ""
        for _ in range(self.length):
            random_text += random.choice(letters)
        return random_text

    def _random_color(self):
        r = random.randint(0, 255)
        g = random.randint(0, 255)
        b = random.randint(0, 255)
        return (r, g, b)

if __name__ == "__main__":
    sc = SimpleCaptcha(length=7, fontsize=36, random_text=True, random_bgcolor=True)
    sc.get_captcha()
