数据分析实战项目-用户行为分析(Python)
数据分析步骤1:明确项目背景和需求
提出问题和应用模型
1.本次分析的目的是为了通过对某电商用户的行为进行分析,从而找到提升GMV方法。
思路:项目GMV的拆解公式为:GMV=UV(独立访客数)* 用户下单转化率 * 客单价,由于数据集不涉及客单价相关的内容,故优化GMV主要考虑提高UV和提升转化率这两个方面。提高UV的方法就是拉新,这需要对我们的用户进行拆解,找出新客户的来源的主要渠道,拉来更多的新用户。提高转化率主要有两方面:一方面是提高转化率高的那群人的占比,这需要找出哪些因素(随机森林模型)影响了用户的转化率,另一方面是找出转化率的环节,看是否有异常,如果有就优化掉。
2.数据探索(EDA)
2.1 数据集信息
因列数太长,无法完全显示,故一一列出各列的含义:
user_id :用户id
new_user :是否新用户 是:1、否:0
age :用户年龄
sex :用户性别
market :用户所在市场级别
device :用户设备
operative_system :操作系统
source :来源
total_pages_visited :浏览页面总数
home_page : 浏览过主页的用户
listing_page : 浏览过列表页的用户
product_page : 浏览过产品详情页的用户
payment_page : 浏览过支付结算页的用户
payment_confirmation_page : 浏览过确认支付完成页的用户
NAN值代表用户未浏览该页面,为了方便后面的计算,此处替换为0.
# 数据清洗
# 将不同页面的nan值替换为0
for col in['home_page','listing_page','product_page','payment_page','confirmation_page']:
    user_info[col].fillna(0,inplace = True)
user_info.head()# 便于计算,利用正则表达式将page页面信息转化为数字
for col in ['home_page','listing_page','product_page','payment_page','confirmation_page']:
user_info[col].replace(re.compile('page'),1,inplace=True)
user_info.head() 接下来通过info()了解数据类型,查看是否有缺失值(NAN)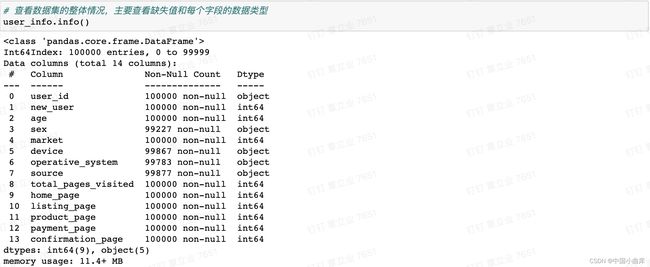
可以看到性别、设备、操作系统、来源存在空值,后面需要进行处理。
最大年龄有123岁,属于异常值,还需进一步查看大于100岁的用户个数。
这是我们项目数据集得到的最终转化率2.4%。
2.2数据预览
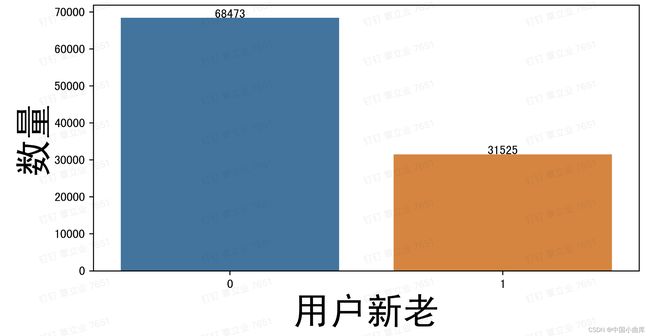
2.3.1 new_user
plt.figure(figsize=(10,6),dpi=400 )
new_user = pd.DataFrame(user_info['new_user'].value_counts().reset_index(name= 'counts'))
g = sns.barplot(x = 'index', y = 'counts',data = new_user)
for index,row in new_user.iterrows():
    g.text(row.name,row.counts,row.counts,color = 'black',ha = 'center')
plt.xlabel('用户新老',fontsize=30)
plt.ylabel('数量',fontsize=30)
# width=0.1
plt.show()
68475的新用户,31525万的老用户,为了直观的观察两者之间的比例,用饼图展示。
2.3.2 age
# age 年龄 选择用直方图观察,是连续型数值变量,所以可以用直方图展示
plt.figure(figsize=(8,6),dpi=400)
sns.displot(user_info['age'])
可以看到年龄基本集中在20~36岁,前面观察到的123基本可以确定为异常值了。
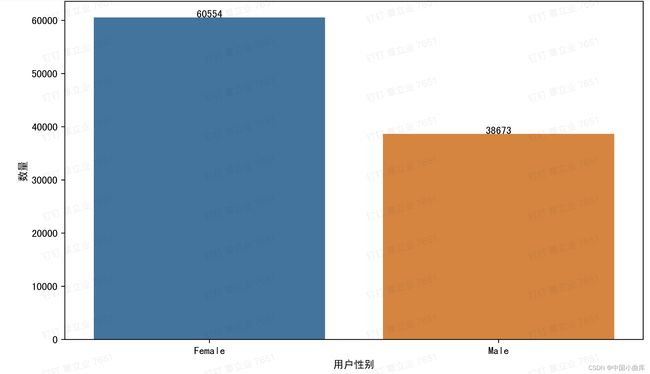
2.3.3 sex
# 性别
plt.figure(figsize=(10,6),dpi = 400)
sex = pd.DataFrame(user_info['sex'].value_counts().reset_index(name='counts'))
g = sns.barplot(x = 'index',y='counts',data = sex)
for index,row in sex.iterrows():
    g.text(row.name,row.counts,row.counts,color = 'black',ha='center')
plt.xlabel('用户性别')
plt.ylabel('数量')
女性的用户数更多,同样的,看看男女之间的比例是多少
sex = pd.DataFrame(user_info['sex'].value_counts())
labels = sex.index
sizes = sex.values
colors = ['green','c','gray','beige','darkkhaki','fuchsia']
explode = (0.05,0)

patches,l_text,p_text = plt.pie(sizes,explode=explode,labels=labels,colors=colors,
                                labeldistance = 1.1,autopct='%2.0f%%',shadow=False,
                                startangle = 90,pctdistance = 0.5)
for t in l_text:
    t.set_size = 30
for t in p_text:
    t.set_size = 20
plt.axis('equal')
plt.legend(loc='upper Right',bbox_to_anchor = (-0.1,1))
plt.grid()
plt.show()
2.3.4 market
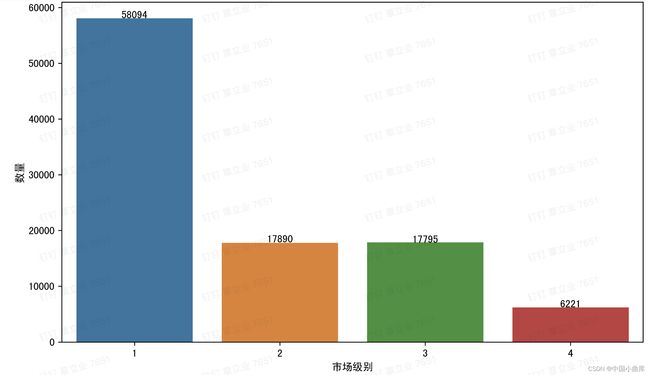
# market  看一下市场,我们看到一线城市的比例明显高于其他城市
plt.figure(figsize=(10,6),dpi = 400)

country = pd.DataFrame(user_info['market'].value_counts().reset_index(name='counts'))

g = sns.barplot(x = 'index',y='counts',data = country)

for index,row in country.iterrows():
    g.text(row.name,row.counts,row.counts,color = 'black',ha='center')

plt.xlabel('市场级别')
plt.ylabel('数量')
一线城市的用户数量明显多于2、3、4线城市。看看他们分别的占比
2.3.5 device
# device 设备   可以看到用手机登陆的,是比直接用桌面网页登陆的多
plt.figure(figsize=(20,8))
device = pd.DataFrame(user_info['device'].value_counts().reset_index(name ='counts'))
g = sns.barplot(x = 'index',y='counts',data = device)
for index,row in device.iterrows():
    g.text(row.name,row.counts,row.counts,color = 'black',ha='center')
plt.xlabel('用户设备')
plt.ylabel('数量')
plt.show()
用手机登陆的该电商的数量,是比直接用桌面网页登陆的多,看看占比。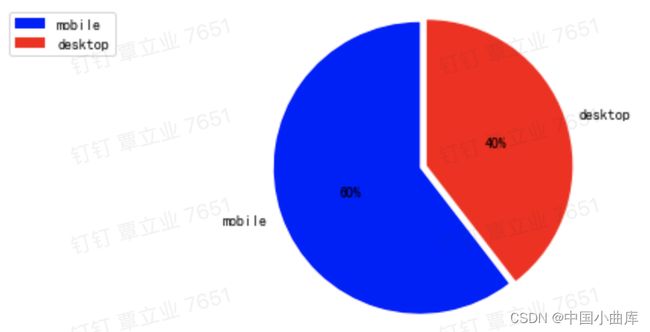
2.3.6 operative_system
# 操作系统,主流的三个操作系统
plt.figure(figsize=(20,8))
operative_system = pd.DataFrame(user_info['operative_system'].value_counts().reset_index(name ='counts'))
g = sns.barplot(x = 'index',y='counts',data = operative_system)
for index,row in operative_system.iterrows():
    g.text(row.name,row.counts,row.counts,color = 'black',ha='center')
plt.xlabel('用户操作系统')
plt.ylabel('数量')
plt.show()
用户使用的最多的还是目前主流的操作系统:windos、iOS、android。看看各类的占比。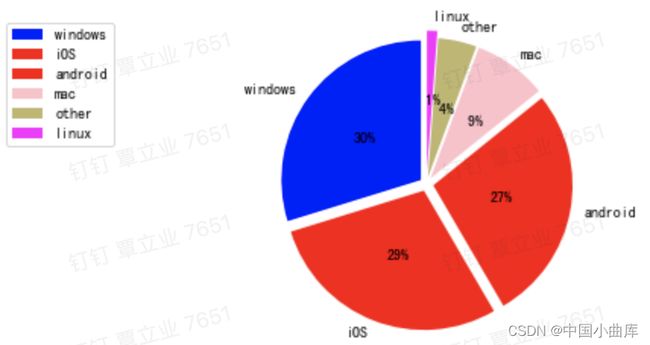
2.3.7 source
# source 用户来源
plt.figure(figsize=(20,8))
source = pd.DataFrame(user_info['source'].value_counts().reset_index(name ='counts'))
g = sns.barplot(x = 'index',y='counts',data = source)
for index,row in source.iterrows():
    g.text(row.name,row.counts,row.counts,color = 'black',ha='center')
plt.xlabel('用户来源')
plt.ylabel('数量')
plt.show()
Direct 代表直接通过网站或者app访问的用户,Seo通过搜索引擎进入电商网站的,Ads指用户通过广告途径进入我们页面。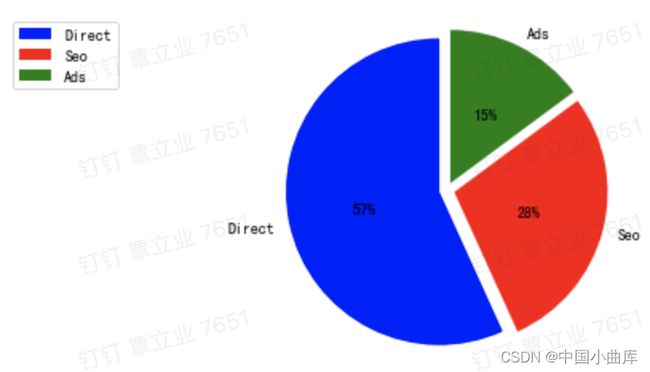
2.3.8 total_pages_visited
# 页面的访问次数 total_pages_visited
plt.hist(user_info['total_pages_visited'],edgecolor = 'k' , alpha = 0.35)
plt.title('页面浏览次数分布')
plt.xlabel('页面浏览总数')
plt.show()
访问页面数在5次以下的用户还是挺多的,这与前面得出的2%转化率相符。
3.数据预处理(Data Processing)
数据清洗:删除原始数据集中的无关数据,重复数据,平滑噪音数据,筛选掉与挖掘主题无关的数据,处理缺失值、异常值等
数据集成:多个数据源合并到一起,存放在一个一致的数据存储位置(数据仓库中),
数据变换:对数据进行规范化处理,将数据转换成适当的形式,以适应于挖掘任务和算法的需求。
简单函数变换:常用来将不具有正态分布的数据转换为具有正态分布的数据。常见方法有对数变换和差分运算。
规范化:为了消除指标之间的量纲和取值范围差异的影响。将数据按照比例进行缩放,使之落入一个特定的区域,便于进行综合分析,对于基于距离的挖掘算法尤为重要,常见方法有:最大-最小值规范化,0-1均值规范化,小数定标规范化【-1,1】,
连续属性离散化:一些挖掘算法,特别是分类算法,长需要讲连续属性变换为分类属性,离散化设计两个字任务,确定分类数以及如何将连续属性映射到这些分类值,常见方法有等宽法和等频法和聚类
属性规约:合并属性,逐步向前选择,逐步向后删除,决策树归纳,主成分分析
数值规约:通过选择代替的,较小的数据来减少数据量,包括参数法(回归模型参数)和无参数法(直方图、聚类、抽样)
3.1.1 异常值分析
异常值分析 : 检验数据是否有录入错误,是否会有不合常理的数据
常用分析方法有:
简单统计量分析:最大值、最小值分析
3sigma原则:如果数据符合正态分布,在3sigma原则下,异常值为一组测定值与平均值的偏差超过三倍标准差的值,属于个别小概率事件,如果数据不符合正态分布,也可以用远离平均值标准差的倍数来表示
箱型图分析:以四分位数和四分位距为基础。
本项目的异常值主要针对数值型变量和 age 和 total_pages_visited
#  age 和 total_pages_visited 的箱型图
boxplot = user_info.boxplot(column = ['age','total_pages_visited'])
根据箱型图判断age中存在两个异常值,total_pages_visited没有异常,需要剔除两个异常值。
# 删除两个异常值
user_info = user_info[user_info['age']<100]
3.1.2 缺失值分析(Miss value)
缺失值分析:
缺失值产生的原因:无法获取、人为遗漏、属性不存在
处理方法:
删除记录:如果比例较低,可以直接删除
数据插补:众数/平均数/中位数,固定值,最近临插补,回归方法、插值法
不处理:有些模型不需要处理缺失值,比如决策树把缺失值作为一种状态
# 查看缺失值个数
user_info.isnull().sum()
source、device、oprative_system、sex均存在缺失值,接下来一一对其缺失值进行处理。
3.1.2.1 source
因为缺失值较少,可以直接删除或直接填入众数
或者根据其他已知数据地分布来填补
在这里猜想新客户的来源有一个主要的渠道,老客户也存在其固定的渠道,通过找出两者的主要来源来填补source的缺失值,为此,我们需要先创建一个没有缺失值的数据来查看新老客户在来源上是否存在我们假设的情况。
# 我们创建一个没有缺失值的数据集去查看规律
user_full = user_info.dropna()
user_full.groupby(['new_user','source'])['user_id'].count()
可以看到老客户主要来源渠道为Direct,新客户主要为Seo,故新客户缺失的source填充为Seo,老客户填充为Direct
# 当用户为新用户,source缺失值填充为direct 老客户填充seo
user_info['source'] = np.where((user_info['source'].isnull())&(user_info['new_user'] == 1),'Seo',user_info['source'])
# 用户为老用户时,source缺失值填充direct
user_info['source'].fillna('Direct',inplace=True)
source处理完毕。
3.1.2.2 device
根据常识, 当操作系统为mac,window,linux device填补为desktop,操作系统为 iOS,android 填充为 mobile。
# 操作系统为mac,window,linux 设备为desktop
user_info['device'] = np.where((user_info['device'].isnull())&(user_info['operative_system'].isin(['mac','windows','linux'])),'desktop',user_info['device'])
# 操作系统为 ioS,android 填充为 mobile
user_info['device'] = np.where((user_info['device'].isnull())&(user_info['operative_system'].isin(['iOS','android'])),'mobile',user_info['device'])
处理完之后再在缺失值的个数,还有11个没有处理完毕,我们直接把这11条数据拉出来,看看是什么情况。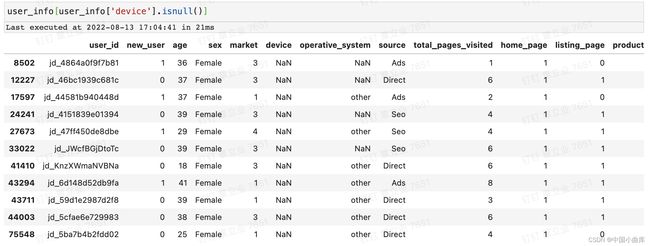
是因为操作系统这个字段存在other和NAN值导致无法填补完全,由于11个影响不大,这里决定用device的众数来填充剩下的11个缺失值 。
3.1.2.3 operative_system
operative_system的处理方式与source 相似,我们找出mobile和desktop分别的主要操作系统,然后对属于mobile的 operative_system的NAN值进行填充。
# 可以看到mobile只要操作系统是iOS,desktop主要操作系统是windows
# 当用户设备时mobile时,操作系统主要为iOS
user_info['operative_system'] = np.where((user_info['operative_system'].isnull())&(user_info['device'] == 'mobile'),'iOS',user_info['operative_system'])
# 当用户设备为desktop,操作系统填充为windows
user_info['operative_system'] = np.where((user_info['operative_system'].isnull())&(user_info['device'] == 'desktop'),'windows',user_info['operative_system'])
user_info.isnull().sum()
operative_system 缺失值处理完毕
3.1.2.4 sex
考虑sex和操作系统的关系,这里也可以有其他的参考值,比如source等。
除了linux,其他操作系统下皆是女性占优,故如果是linux可以填补为male,其他操作系统填补为female。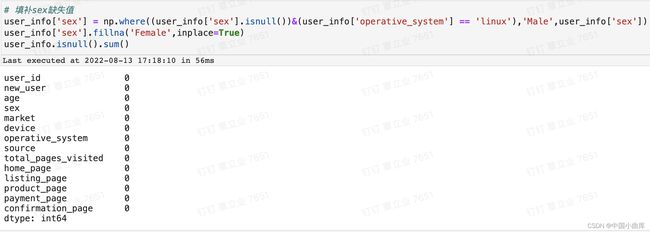
3.1.3 一致性分析
在数据挖掘过程中,不一致的数据主要发生在数据集成的过程中,可能数据来自不同数据源,重复存放的数据未能一致性更新造成的,本项目主要对male和female的大小写进行统一。
4.数据建模
4.1 漏斗分析
如果是转换率下降导致GMV下降,用漏斗分析,用户从进入平台到最终完成购买这个路径当中,经历了那些页面,在不同的页面都会产生一定的用户流失,如果在某个页面,用户流失非常高,就需要定位到这个页面去看,是不是这个页面或者功能让用户产生了不好的体验,从而导致用户大量流失。
先查看总体的流失情况
convertion = []
page = ['home_page','listing_page','product_page','payment_page','confirmation_page']
for col in range(len(page)-1):
    print(user_info[page[col+1]].sum())
    print(user_info[page[col]].sum())
convertion.append(user_info[page[col+1]].sum()/user_info[page[col]].sum())拓展分析:
市面上竞争对手的产品页➡️支付页转化率在15-18%,对比我们的网站,从产品页➡️支付页的转化率只有13.8%,有待提高。
纬度拆解分析和对比分析:
普通的漏斗分析很简单,但一定要通过不同维度的分析,计算对应的转化率,才能挖到真正的业务痛点。通过对比分析 找到核心纬度的痛点,并采取措施
sex_convertion = []
page = ['home_page','listing_page','product_page','payment_page','confirmation_page']
for i in range(len(sex_funnel.index)):
    for col in range(len(page)-1):
sex_convertion.append(sex_funnel[page[col+1]][i].sum()/sex_funnel[page[col]][i].sum())
s = ['female']*4 + ['male']*4
[*zip(s,list*2,sex_convertion)]
sex_funnel = pd.DataFrame([*zip(s,list*2,sex_convertion)]).rename(columns = {0:'sex',1:'flow',2:'sex_convertion'})
sex_funnel
从上面这张图可以看出,前面的几个环节,男性和女性的转化率差不多,从支付页➡️支付完成页,男性的比例少于女性,除了男性在付款的时候比较理性以外,其他可能的原因还有:
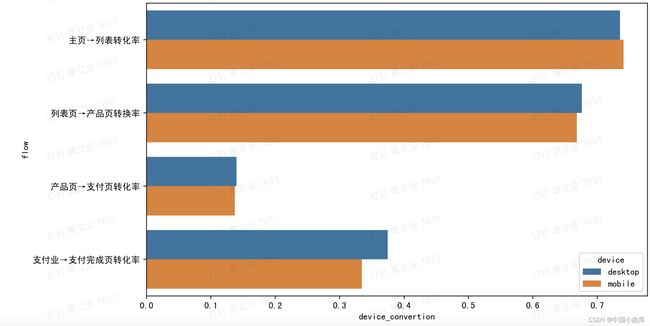
4.1.2漏斗分析:device纬度
device_funnel = user_info.groupby(['device'])['home_page','listing_page','product_page','payment_page','confirmation_page'].sum()
device_convertion = []
page = ['home_page','listing_page','product_page','payment_page','confirmation_page']
for i in range(len(device_funnel.index)):
    for col in range(len(page)-1):
        device_convertion.append(device_funnel[page[col+1]][i].sum()/device_funnel[page[col]][i].sum())
s = ['desktop']*4 + ['mobile']*4
[*zip(s,list*2,device_convertion)]
device_funnel = pd.DataFrame([*zip(s,list*2,device_convertion)]).rename(columns = {0:'device',1:'flow',2:'device_convertion'})
plt.figure(figsize = (10,6),dpi=400)
sns.barplot(x = 'device_convertion', y = 'flow',hue = 'device' , data = device_funnel)
plt.show()
前几步转化率差不多,明显从desktop支付页➡️支付完成的转化率比mobile高。
为什么desktop桌面端做的比mobile手机端的好,以及mobile有哪些地方需要优化,
填地址、或者支付方式更简单一些?
5. 特征工程
特征工程:
特征构建:从原始数据中人工的构建新的特征(考虑年龄做一个分箱、用户在五个页面的平均访问次数)
特征构建常用的方法有和差积商
特征选择:
1、基于业务知识或者实践经验
2、过滤法:方差过滤法、相关系数法、卡方检验法、互信息法
3、嵌入法:决策树
4、包装法
特征处理:
连续特征:不做处理,归一化、标准化等
无序类别特征:OneHotEncoder独热编码
有序类别特征:LabelEncoder标签编码
构建建模数据集,再把converted改为标签值:
# deep=False相当于引用,原值改变复制的结果随着改变,等价于model_info = user_info
model_info = user_info.copy(deep = True)
# 把转化converted作为因变量label
model_info['converted'] = model_info['confirmation_page']
model_info.head()
5.1 特征构建
我们构建一个新的字段platform:app和web ,用户浏览的平台是app还是web
# 新建一个platform:app和web 用户浏览的平台是app还是web
model_info['platform'] = model_info['device']
# 将mobile 转换为app,desktop 转化为web
platform = {'mobile':'app','desktop':'web'}
model_info['platform'] = model_info['platform'].map(platform)

model_info.head()
再把device和operative_system 合并为一个特征,在把原始数据集中的operative_system和device删除掉:
model_info['os'] = model_info['device'] + '_' + model_info['operative_system']
model_info.drop(['device','operative_system'],axis=1,inplace = True)
model_info.head()
5.2特征选择
我们选择删除掉'user_id','home_page','listing_page','product_page','payment_page','confirmation _page'这几个与转化无关的特征,因为实际情况下,用户可能直接从首页进入购物车进行购买,这时候考虑这几个页面没有参考价值。
model_info.drop(['user_id','home_page','listing_page','product_page','payment_page','confirmation_page'],axis=1,inplace = True)
model_info.head()
5.3 特征处理
对于逻辑回归模型:
连续型数据特征:不处理或标准化处理
无序类别特征:OneHotEncoder
有序类别特征:LabelEncoder
data_LR = pd.get_dummies(model_info,drop_first=False)
data_LR.head()
连续特征 total_pages_visited,进行归一化处理,本质上是将数据集映射到了【0-1】区间内
# reshape(-1,1)表示任意行,1列
# reshape(1,-1)表示1行,任意列
data_LR['total_pages_visited'] = MinMaxScaler().fit_transform(data_LR['total_pages_visited'].values.reshape(-1,1)).reshape(1,-1)[0]
data_LR.head()
对于树模型(决策树和随机森林):
连续型数据特征不处理,
类别特征LabelEncoder和OneHotEncoder都可以,数值只是一个类别符号,没有大小概念,即没有偏序关系。
#  OneHotEncoder独热编码
date_tree = pd.get_dummies(model_info,drop_first=False)
date_tree.head()
# LabelEncoder标签编码
date_tree1 = model_info.copy(deep= True)
#性别
sex_le = LabelEncoder()
date_tree1['sex'] = sex_le.fit_transform(date_tree1['sex'])
date_tree1.head()6. 建模
6.1 逻辑回归
6.1.1 划分训练集和测试集
np.random.seed(4684)
x = data_LR.drop(['converted'],axis=1)
y = data_LR['converted']
train_X,test_X,train_Y,test_Y = train_test_split(x,y,test_size= 0.2 , random_state=1)
6.1.2 用训练集训练模型
from sklearn.linear_model import LogisticRegression
logic_model = LogisticRegression(random_state= 42 )
logic_model.fit(train_X,train_Y)
6.1.3 用训练好的模型来预测测试集
predict_Y = logic_model.predict(test_X)
predict_Y
from sklearn.metrics import accuracy_score,precision_score,recall_score,f1_score,roc_auc_score
data = {'test_Y':test_Y,'predict_Y':predict_Y}

df = pd.DataFrame(data,columns=['test_Y','predict_Y'])

# crosstab 交差列表取值,第一个参数是列,第二个参数是行
confusion_matrix = pd.crosstab(df['test_Y'],df['predict_Y'],rownames= ['Actual'],colnames=['Predict'])

print(confusion_matrix,'\n')
print('accuracy %s' % accuracy_score(test_Y,predict_Y))
print('precision %s' % precision_score(test_Y,predict_Y))
print('recall %s' % recall_score(test_Y,predict_Y))
print('f1 %s' % f1_score(test_Y,predict_Y))
如何选择合适的模型评估方法:根据项目背景以及目的
测试集的用户有19785个,实际会下单的用户有338+147=485个,预测会下单的用户有68+147=215
precision精确率=147(预测下单=实际下单:预测正确)/(68+147)(所有预测会下单的用户数)=0.683
recall召回率=147(预测下单=实际下单:预测正确)/(338+147)(所有实际会下单的用户数)=0.303
F1=2*(precision精确率*recall召回率)/(precision精确率 + recall召回率),综合考虑p和r的指标
这个数据集共有10W条,成功下单转化的只有2000多人,数据偏态很严重,需要进行欠采样处理。
根据模型得到特征重要性
feature_importances = pd.Series(abs(logic_model.coef_[0]),index=data_LR.drop(['converted'],axis=1).columns)
feature_importances.sort_values(ascending = False)
6.2决策树
6.2.1划分训练集和测试集
np.random.seed(4684)
x = data_tree.drop(['converted'],axis=1)
y = data_tree['converted']
train_X,test_X,train_Y,test_Y = train_test_split(x,y,test_size= 0.2 , random_state=1)
6.2.2 用训练集训练模型
from sklearn.tree import DecisionTreeClassifier
logic_model = LogisticRegression(random_state= 42 )
tree_model = DecisionTreeClassifier(random_state = 1)
tree_model.fit(train_X,train_Y)
6.1.3 用训练好的模型来预测测试集
data = {'test_Y':test_Y,'predict_Y':predict_Y}
df = pd.DataFrame(data,columns=['test_Y','predict_Y'])
# crosstab 交差列表取值,第一个参数是列,第二个参数是行
confusion_matrix = pd.crosstab(df['test_Y'],df['predict_Y'],rownames= ['Actual'],colnames=['Predict'])

print(confusion_matrix,'\n')
print('accuracy %s' % accuracy_score(test_Y,predict_Y))
print('precision %s' % precision_score(test_Y,predict_Y))
print('recall %s' % recall_score(test_Y,predict_Y))
print('f1 %s' % f1_score(test_Y,predict_Y))
7.调参
7.1 随机搜索模型进行调参
# 随机搜索:从超参数空间中随机选择参数组合:
from sklearn.model_selection import RandomizedSearchCV

parameters = {
        'min_samples_leaf':[*range(1,50,5)],
        'max_depth':[*range(1,10)],
        'criterion':['gini','entropy'],
        'splitter':['best','random'],
        'min_impurity_decrease':[*np.linspace(0,0.5,50)]
}

dt = DecisionTreeClassifier(random_state = 1)

# estimator选择使用的分类器,并且传入需要确定的最佳的参数之外的其他参数
# param_grid 需要最优化的参数的值,值为字典或者列表

RS = RandomizedSearchCV(dt,parameters,n_iter=100,scoring= 'f1')
RS = RS.fit(train_X,train_Y)
7.2 重新进行建模
best_model = RS.best_estimator_
best_model.fit(train_X,train_Y)
predict_Y = best_model.predict(test_X)
data = {'test_Y':test_Y,'predict_Y':predict_Y}
df = pd.DataFrame(data,columns=['test_Y','predict_Y'])

# crosstab 交差列表取值,第一个参数是列,第二个参数是行
confusion_matrix = pd.crosstab(df['test_Y'],df['predict_Y'],rownames= ['Actual'],colnames=['Predict'])

print(confusion_matrix,'\n')
print('accuracy %s' % accuracy_score(test_Y,predict_Y))
print('precision %s' % precision_score(test_Y,predict_Y))
print('recall %s' % recall_score(test_Y,predict_Y))
print('f1 %s' % f1_score(test_Y,predict_Y))


