如何了解Ski-learn提供的连续型数据集构造——以波士顿房价数据集为例
一、利用描述算法语句
from sklearn.datasets import load_boston

boston = load_boston()
# 输出对boston数据集的描述
print("波士顿房价的数据集描述是\n", boston.DESCR)
控制台显示的对波士顿房价数据的描述如下:
波士顿房价的数据集描述是
 .. _boston_dataset:

Boston house prices dataset
---------------------------

**Data Set Characteristics:**

    :Number of Instances: 506

    :Number of Attributes: 13 numeric/categorical predictive. Median Value (attribute 14) is usually the target.

    :Attribute Information (in order):
        - CRIM     per capita crime rate by town
        - ZN       proportion of residential land zoned for lots over 25,000 sq.ft.
        - INDUS    proportion of non-retail business acres per town
        - CHAS     Charles River dummy variable (= 1 if tract bounds river; 0 otherwise)
        - NOX      nitric oxides concentration (parts per 10 million)
        - RM       average number of rooms per dwelling
        - AGE      proportion of owner-occupied units built prior to 1940
        - DIS      weighted distances to five Boston employment centres
        - RAD      index of accessibility to radial highways
        - TAX      full-value property-tax rate per $10,000
        - PTRATIO  pupil-teacher ratio by town
        - B        1000(Bk - 0.63)^2 where Bk is the proportion of blacks by town
        - LSTAT    % lower status of the population
        - MEDV     Median value of owner-occupied homes in $1000's

    :Missing Attribute Values: None

    :Creator: Harrison, D. and Rubinfeld, D.L.

This is a copy of UCI ML housing dataset.
https://archive.ics.uci.edu/ml/machine-learning-databases/housing/


This dataset was taken from the StatLib library which is maintained at Carnegie Mellon University.
显然,波士顿房价数据集的特征共有14种,分别是CRIM(城镇人均犯罪率)、ZN(占地面积超过25000平方英尺的住宅用地比例)、INDUS(非零售商业用地占比)、CHAS(是否临河)、NOX(氮氧化物浓度)、RM(房屋房间数)、AGE(房屋年龄)、DIS(和就业中心的距离)、RAD(是否容易上高速路)、TAX(税率)、PTRATTO(学生人数比老师人数)、B(城镇黑人比例计算的统计值)、LSTAT(低收入人群比例)和MEDV(房价中位数)。
波士顿房价的标签数据是样本的房价,显然,这是一个连续型标签数据。
二、采用excel表格的形式输出波士顿房价数据集,样本数据一览无余
# 采用excel输出boston数据集数据
col = list(boston["feature_names"])
m1 = pd.DataFrame(X, index=range(506), columns=col)
m2 = pd.DataFrame(y, index=range(506), columns=["outcomes"])
m3 = m1.join(m2, how='outer')
m3.to_excel("./boston.xls")
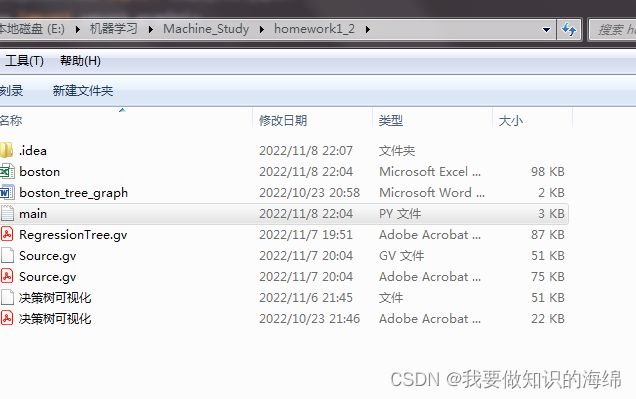
上述代码的输出:在工程的文件夹中可见boston.xls
波士顿房价数据集的样本条数共505条。但是index设为506,是因为还需要一行显示数据类型和标签类型。
