机器学习模型自我代码复现:回归
根据模型的数学原理进行简单的代码自我复现以及使用测试,仅作自我学习用。模型原理此处不作过多赘述,仅罗列自己将要使用到的部分公式。代码框架部分参照了以下视频中的内容。清华博士爆肝300小时录制!!机器学习入门必备的10个经典算法(原理+复现+实验)被他讲得如此清晰!_哔哩哔哩_bilibili
如文中或代码有错误或是不足之处,还望能不吝指正。
线性回归,主要任务是寻找一个或多个因变量与自变量之间的关系,拟合出![]() 形式的回归方程。
形式的回归方程。
求解线性回归时,根据最小二乘法,要找到使得误差平方和![]() 的最小
的最小![]() ,针对
,针对![]() 求偏导,可以得到
求偏导,可以得到![]() 。针对于存在的求逆操作,使用梯度下降法求解。
。针对于存在的求逆操作,使用梯度下降法求解。
![]() 其中α为学习率,m为每次梯度下降时传入的样本数量。
其中α为学习率,m为每次梯度下降时传入的样本数量。
岭回归在原本的误差平方和的基础上加入了L2惩罚项![]() ,牺牲无偏性,增大偏差以减少方差,在出现多重共线性(自变量并不独立,而是互相之间存在关系)以及数据中有离群点时效果较好;用“机器学习”一点的话就是“模型更加稳定”。在实际的梯度下降中只需要再加入一个关于L2惩罚项偏导方向上的更新
,牺牲无偏性,增大偏差以减少方差,在出现多重共线性(自变量并不独立,而是互相之间存在关系)以及数据中有离群点时效果较好;用“机器学习”一点的话就是“模型更加稳定”。在实际的梯度下降中只需要再加入一个关于L2惩罚项偏导方向上的更新![]() 即可。
即可。
Lasso回归则是加入了L1惩罚项![]() ,以此来剔除无关变量。但是由于L1惩罚项在0点处不是可微的,故而使用坐标下降法(每次只更新一个
,以此来剔除无关变量。但是由于L1惩罚项在0点处不是可微的,故而使用坐标下降法(每次只更新一个![]() )求解。
)求解。
import numpy as np
import pandas as pd
import random
from sklearn.preprocessing import  PolynomialFeatures

class LinearRegression:
    def pre_processing(self,data,polynomial_degree=1,sinusoid_degree=0,normalize_data=True):
        """
        数据预处理
        """
        if polynomial_degree>=1:#多项式
            poly = PolynomialFeatures(polynomial_degree)
            data = poly.fit_transform(data)

        if sinusoid_degree>0:#sin函数非线性变换
            sinusoid = np.empty((data.shape[0],0))
            for i in range(1,sinusoid_degree+1):
                sinusoid_feature = np.sin(i*data)
                sinusoid = np.concatenate((sinusoid,sinusoid_feature),axis=1)
            data = sinusoid
        if normalize_data:
            data = (data-self.feature_mean)/self.feature_std
        return data

    def __init__(self,data,labels,polynomial_degree=1,sinusoid_degree=0,normalize_data=True,threshold=1e-9):
        self.feature_mean = np.mean(data)
        self.feature_std = np.std(data)
        self.threshold = threshold #权重变化阈值
        self.data = self.pre_processing(data,polynomial_degree,sinusoid_degree,normalize_data)
        self.labels = labels
        self.polynomial_degree=polynomial_degree
        self.sinusoid_degree=sinusoid_degree
        self.normalize_data=normalize_data
        feature_num = self.data.shape[1]
        self.weight = np.zeros((feature_num,1)) #初始化w矩阵


    def train(self,alpha=0.1,num_iterations = 1000,gradient_m=128,get_weight_history = False,alpha_ridge = 0,alpha_lasso=0):
        """
        alpha:学习率
        num_iterations:梯度/坐标下降做大次数
        gradient_m:每次迭代使用样本数量,-1时为批量梯度下降(BGD)
        get_weight_history:是否返回权重的训练历史信息
        alpha_ridge:岭回归中L2惩罚项的权重
        alpha_lasso:Lasso回归中,L1惩罚项的权重
        """
        cost_history = self.gradient_descent(alpha,num_iterations,gradient_m,get_weight_history,alpha_ridge,alpha_lasso)
        return self.weight,cost_history

    def gradient_descent(self,alpha,num_iterations,gradient_m,get_weight_history,alpha_ridge = 0,alpha_lasso=0):
        """
        梯度/坐标下降过程,参数同train()中的一样
        """
        if gradient_m==-1 or self.data.shape[0]<128:
            gradient_m = self.data.shape[0]
        cost_history=[]
        weight_history = []
        for i in range(num_iterations):
            self.gradient_step(alpha,gradient_m,alpha_ridge,alpha_lasso)
            last_cost = self.cost_function(self.data,self.labels,gradient_m,alpha_ridge,alpha_lasso)
            cost_history.append(last_cost)
            if get_weight_history:
                weight_history.append(self.weight)
            if len(cost_history)>2 and abs(cost_history[-1]-cost_history[-2]) 0时,由于L1正则项有绝对值,损失函数在0处不可导,故而使用坐标下降法
        否则使用梯度下降法
        参数同cost_function
        """
        idx = random.sample(range(self.data.shape[0]),example_num)
        data = self.data[idx]
        labels = self.labels[idx]
        prediction = LinearRegression.hypothesis(data,self.weight)
        if alpha_lasso == 0:
            delta = prediction-labels
            weight = self.weight
            weight = weight - alpha*(1/example_num)*(np.dot(delta.T,data)).T - alpha_ridge*(weight)
            self.weight = weight
        else:
            for k in range(data.shape[1]):
                rk = np.dot(data[:,k],labels-prediction+data[:,k].reshape([example_num,1])*self.weight[k])
                rk = rk/(1.0*example_num)
                zk = np.linalg.norm(data[:,k],2)**2
                zk = zk/(1.0*example_num)
                res = (np.max([rk-alpha_lasso,0])-np.max([-rk-alpha_lasso,0]))/zk+alpha_ridge*self.weight[k]
                self.weight[k] = res
    @staticmethod
    def hypothesis(data,weight):
        """
        计算因变量
        """
        predictions = np.dot(data,weight)
        return predictions

    def get_cost(self,data,labels):
        """
        计算损失值
        """
        data = self.pre_processing(data)
        return self.cost_function(data,labels,data.shape[0])

    def predict(self,data):
        """
        从新数据(测试集)上预测
        """
        data = self.pre_processing(data,self.polynomial_degree,self.sinusoid_degree,self.normalize_data)
        predictions = LinearRegression.hypothesis(data,self.weight)
        return predictions
接下来分别对于多项式、迭代样本数量、岭回归、Lasso功能通过自建数据进行测试。
import pandas as pd
import numpy as np
import matplotlib.pyplot as plt
import matplotlib as mpl
from sklearn.model_selection import train_test_split

mpl.rcParams["axes.unicode_minus"]=False
mpl.rcParams["font.family"]="SimHei"
mpl.rcParams["font.size"]=12


#加入多项式训练测试
X = np.random.randn(500,1)
y = 3*X+2*X**3+np.random.randn(500,1)
X_test = np.linspace(min(X),max(X),100)

x_train,x_test,y_train,y_test=train_test_split(X,y)
lr1 = LinearRegression(x_train,y_train,polynomial_degree=1)
lr2 = LinearRegression(x_train,y_train,polynomial_degree=3)
w1,cost1 = lr1.train()
w2,cost2 = lr2.train()
prediction1 = lr1.predict(x_test)
prediction2 = lr2.predict(x_test)

from sklearn.metrics import mean_absolute_error
print("多项式最高次为1时的MSE为",mean_absolute_error(prediction1,y_test))
print("多项式最高次为3时的MSE为",mean_absolute_error(prediction2,y_test))

"""
多项式最高次为1时的MSE为 3.2379167323234905
多项式最高次为3时的MSE为 0.8667261476837446
"""
plt.scatter(X,y,s=2,label="原始数据")
plt.plot(X_test,lr1.predict(X_test),c='red',label="1次多项式")
plt.plot(X_test,lr2.predict(X_test),c='orange',label="3次多项式")
plt.legend()
plt.show()
加入多项式后的训练结果达到预期效果。
lr_BGD = LinearRegression(x_train,y_train,polynomial_degree=3)
weight_BGD,cost_BGD = lr_BGD.train(alpha=0.001,gradient_m=-1)
lr_SGD = LinearRegression(x_train,y_train,polynomial_degree=3)
weight_SGD,cost_SGD = lr_SGD.train(alpha=0.0001,gradient_m=1)
lr_MBGD = LinearRegression(x_train,y_train,polynomial_degree=3)
weight_MBGD,cost_MBGD = lr_MBGD.train(gradient_m=128)

plt.figure(figsize=(10,10))
plt.subplot(221)
plt.plot(cost_SGD,c='r')
plt.title("随机梯度下降")
plt.subplot(222)
plt.plot(cost_BGD,c='b')
plt.title("批量梯度下降")
plt.subplot(223)
plt.plot(cost_MBGD,c='g')
plt.title("MiniBatch梯度下降")
plt.subplot(224)
plt.plot(cost_BGD,'-',linewidth=4,c='r',label = "批量梯度下降")
plt.plot(cost_SGD,'-*',c='b',label = "随机梯度下降")
plt.plot(cost_MBGD,'-',c='g',label = "MiniBatch梯度下降")
plt.title("三种梯度下降对比")
plt.legend()
plt.show()
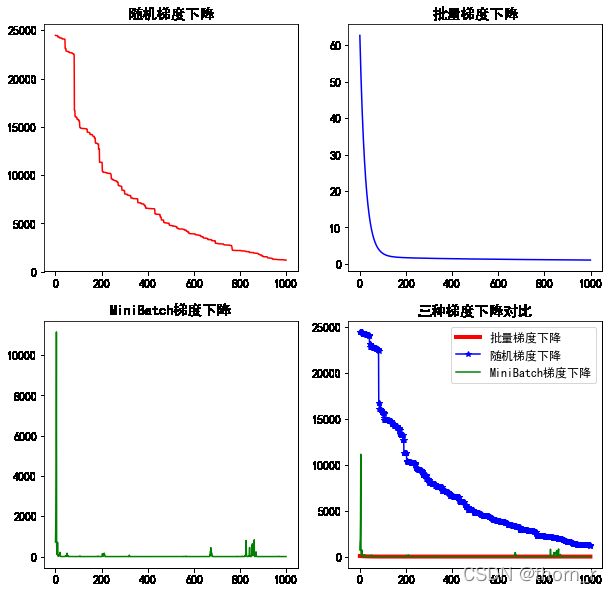
理论上随机梯度下降(每次只训练1个样本)的速度最快,但是不稳定;批量梯度下降(每次训练所有样本)最为稳定,但是耗时更长。MiniBatch此处每次选择128个样本作训练,同时兼顾速度与稳定性。
X = np.random.randn(300,1)
y_old = 3*X+2*X**3+5+2+np.random.randn(300,1)
#加入极端值
y = y_old.copy()
for i in np.random.randint(100,200,20):
    y[i]+=100
df = np.c_[X,y,y_old]
random.shuffle(df)
X = df[:,0].reshape([300,1])
y = df[:,1].reshape([300,1])
y_old = df[:,2].reshape([300,1])
X_new = np.linspace(min(X),max(X),300).reshape([300,1])

plt.subplot(121)
plt.scatter(X,y)
plt.subplot(122)
plt.scatter(X,y_old)
plt.show()
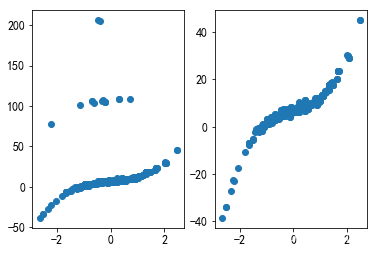
在训练样本中,加入了一定量的极端值,观察岭回归的效果 。
lr2 = LinearRegression(X,y,polynomial_degree=3)
lr3 = LinearRegression(X,y,polynomial_degree=3)
w2,cost2 = lr2.train()
w3,cost3 = lr3.train(alpha_ridge=0.1)

plt.scatter(X,y_old,s=10,c='green')
plt.plot(X_new,lr2.predict(X_new),label='最小二乘(无偏)',c='red')
plt.plot(X_new,lr3.predict(X_new),label = '岭回归(有偏)',c='blue')
plt.title("岭回归平稳性")
plt.legend()
plt.show()

plt.scatter(X,y,s=10,c='green')
plt.plot(X_new,lr2.predict(X_new),label='最小二乘(无偏)',c='red')
plt.plot(X_new,lr3.predict(X_new),label = '岭回归(有偏)',c='blue')
plt.legend()
plt.title("岭回归平稳性")
plt.show()
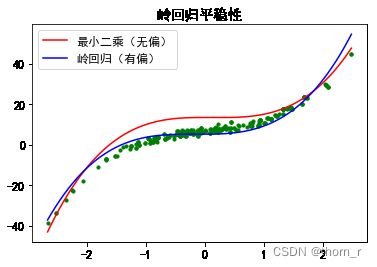
最小二乘回归会受到“离群点”的影响,而岭回归牺牲偏差,使得方差更小,模型更稳定。
X1 = np.random.randn(300,1)
X2 = np.random.randn(300,1)
X3 = np.random.randn(300,1)
y = 3*X1+2*X2+2+0.1*np.random.randn(300,1)
df = np.c_[X1,X2,X3,y]
X1 = df[:,0].reshape([300,1])
X2 = df[:,1].reshape([300,1])
X3 = df[:,2].reshape([300,1])
y = df[:,3].reshape([300,1])
X = np.c_[X1,X2,X3]
x_train,x_test,y_train,y_test=train_test_split(X,y)


lr_lasso = LinearRegression(x_train,y_train)
lr_ridge = LinearRegression(x_train,y_train)
lr = LinearRegression(x_train,y_train)
w_lasso,cost_lasso=lr_lasso.train(alpha_lasso=0.1)
w_ridge,cost_ridge=lr_ridge.train(alpha_ridge=0.1)
w,cost=lr_lasso.train()

print("Lasso回归MSE:",mean_absolute_error(lr_lasso.predict(x_test),y_test))
print("最小二乘(无偏)回归MSE:",mean_absolute_error(lr.predict(x_test),y_test))
print("Ridge回归MSE:",mean_absolute_error(lr_ridge.predict(x_test),y_test))

"""
Lasso回归MSE: 0.08544432090388751
最小二乘(无偏)回归MSE: 2.7294320484076784
Ridge回归MSE: 1.3695371794303401
"""

print(w_lasso)

"""
array([[1.86408802], 偏置
       [2.98518226], X1
       [1.97446405], X2
       [0.        ]]) X3
"""
在数据中出现“多余特征”(X3)时,L1惩罚项将其系数降为了0,MSE小于岭回归与最小二乘的无偏回归。


