数字图像处理实验八--图像分割
数字图像处理实验八
(图像分割)
实验内容:
- 采用sobel、prewitt、roberts和log对图像及其加上噪声后的图像进行边缘检测。
- 采用迭代式阈值选择法和最大类间方差阈值选择法进行图像分割。
实验步骤:
- 以chair.jpg图像为例,分别采用sobel、prewitt、roberts和log对该图像及其加上噪声后的图像进行边缘检测。
I1=imread('chair.jpg');
figure;
subplot(3,4,1);
imshow(I1);
xlabel("原始图像")%显示原图像
I2=imnoise(I1, 'gaussian',0,0.01);%对灰度图像加入均值为0,方差为0.01的高斯噪声
subplot(3,4,2);
imshow(I2),xlabel('加高斯噪声后的图像')%显示加噪声后的图像

BW1=edge(I1,'roberts');%用Roberts算子检测边缘
subplot(3,4,3);
imshow(BW1),xlabel('roberts边缘检测')
BW2=edge(I1,'prewitt');%用Prewitt算子检测边缘
subplot(3,4,4);
imshow(BW2),xlabel('prewitt边缘检测')
BW3=edge(I1,'sobel');%用Sobel算子检测边缘
subplot(3,4,5);
imshow(BW3),xlabel('sobel边缘检测')
BW4=edge(I1,'log');%用LOG算子检测边缘
subplot(3,4,6);
imshow(BW4),xlabel('log边缘检测')

BW5=edge(I2,'roberts');%用Roberts算子检测边缘
subplot(3,4,7);
imshow(BW5),xlabel('roberts边缘检测(加噪声)')
BW6=edge(I2,'prewitt');%用Prewitt算子检测边缘
subplot(3,4,9);
imshow(BW6),xlabel('prewitt边缘检测(加噪声)')
BW7=edge(I2,'sobel');%用Sobel算子检测边缘
subplot(3,4,12);
imshow(BW7),xlabel('sobel边缘检测(加噪声)')
BW8=edge(I2,'log');%用LOG算子检测边缘
subplot(3,4,8);
imshow(BW8),xlabel('log边缘检测(加噪声)')
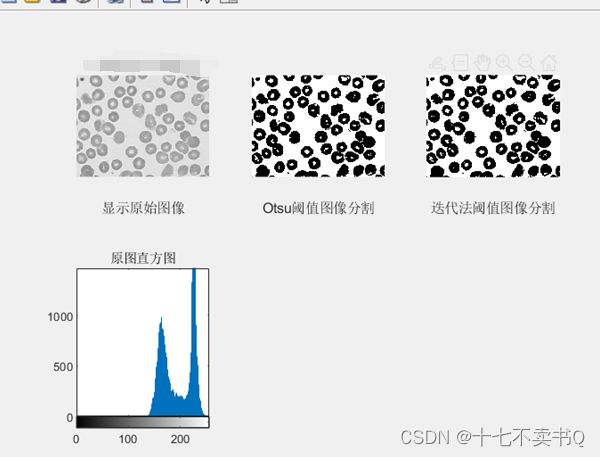
- 以cell.jpg图像为例,分别迭代式阈值选择法和最大类间方差阈值选择法对该图像进行分割。
I = imread("cell.jpg");
[width,height] = size(I); %获取图像的高度和宽度
figure();
subplot(2,3,1),imshow(I);
title('实验人-谷傲雷')
xlabel("显示原始图像")

subplot(2,3,4),imhist(I); %显示原始图像的直方图
title("原图直方图");

T2 = graythresh(I); %用最大类间方差(Otsu)选择阈值
BW2 = im2bw(I,T2); %Otsu阈值对图像进行分割
subplot(2,3,2),imshow(BW2);
xlabel('Otsu阈值图像分割')

f = double(I); %迭代法求出来阈值
T = (min(f(:))+max(f(:)))/2;
done = false
i = 0;
while ~done
    r1 = find(f<=T);
    r2 = find(f>T);
    Tnew = (mean(f(r1))+mean(f(r2)))/2
    done = abs(Tnew-T)<1
    T = Tnew;
    i = i+1;
end
f(r1) = 0;
f(r2) = 1;%迭代法得到的阈值对图像进行分割
subplot(2,3,3),imshow(f);
xlabel('迭代法阈值图像分割');
问题讨论:
Roberts 算子可以得到非常细的边缘,最大的优点是计算量小速度快,适用于边缘明显且噪声较少的图像分割。Prewitt 算子和 Sobel 算子检测出的结果类似,LOG 算子检测出的边缘比较连贯。

