2019独角兽企业重金招聘Python工程师标准>>> ![]()
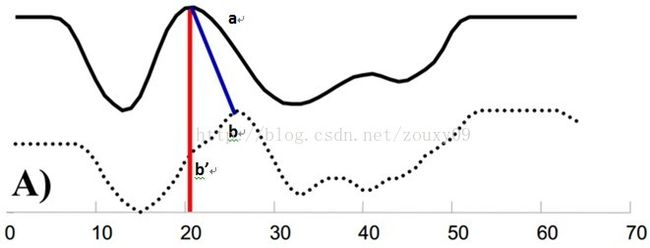
某些特殊场景下,普通的欧式距离、曼哈顿距离等并不能满足我们的需求。例如在语音识别中,常使用DTW距离(Dynamic Time Warping,动态时间归整),如下图,实线和虚线分别是同一个词“pen”的两个语音波形(在y轴上拉开了,以便观察)。可以看到他们整体上的波形形状很相似,但在时间轴上却是不对齐的。
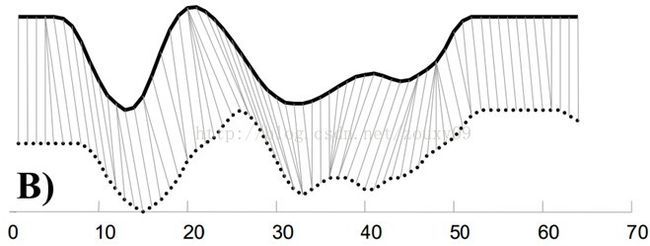
同时间度量转变为同模式度量,才能更好地反映2个语音波形的相似性:
(图片转载自:https://www.cnblogs.com/Daringoo/p/4095508.html)
而在sklearn中,我们可以自定义部分机器学习模型的距离函数,例如聚类算法DBSCAN就可以自定义距离:
dbscan = DBSCAN(eps=14,
                min_samples=2,
                metric=lambda a, b: DTW.distance(a, b))
使用metric参数即可。那么算法对这个距离函数有什么要求呢?
1、给出2组feature,它们的类型都是np.ndarray
2、返回一个距离,数据类型是float
为了使得距离适应DTW的特性(即长短不一致),又符合同类相比的距离标准(即所有feature长度一致),我们使用一个特殊数字-9999来填充所有的曲线,使它们长度一直。在运算中,我们用return_center_data函数把这个数字去掉,使得DTW算法能够正确地对原始数据进行距离计算。
由于函数输入变量的类型为np.ndarray,我们为了后续方便操作,全部转化为list类型
    @staticmethod
    def distance(s1, s2, signal_num=-9999):
        # type: (np.ndarray, np.ndarray, int) -> float
        tmp_s1 = []
        for i in s1:
            tmp_s1.append(i)
        tmp_s2 = []
        for i in s2:
            tmp_s2.append(i)
        s1_in = DTW.return_center_data(tmp_s1, signal_num)
        s2_in = DTW.return_center_data(tmp_s2, signal_num)
        result = DTW.dtw(s1_in, s2_in, DTW.dist_for_float)[0]

        return result
这样就能正确计算距离,并且聚类了:
聚类结果为:
[0 0 1 1 1]
结果显示曲线可分成两类。详细两两对比的距离结果如下:
(14.0, [1.0, 2.0, 3.0, 11.0, 11.0, 6.0, 6.0, 6.0, 6.0], [2.0, 2.0, 3.0, 11.0, 4.0, 6.0, 6.0, 6.0, 7.0])
(41.0, [1.0, 2.0, 3.0, 11.0, 11.0, 6.0, 6.0, 6.0, 6.0], [3.0, 8.0, 3.0, 1.0, 2.0, 3.0, 3.0])
(40.0, [1.0, 2.0, 3.0, 11.0, 11.0, 6.0, 6.0, 6.0, 6.0], [4.0, 8.0, 3.0, 1.0, 2.0, 3.0, 4.0])
(42.0, [1.0, 2.0, 3.0, 11.0, 11.0, 6.0, 6.0, 6.0, 6.0], [5.0, 8.0, 3.0, 1.0, 2.0, 3.0, 3.0, 4.0])
(33.0, [2.0, 2.0, 3.0, 11.0, 4.0, 6.0, 6.0, 6.0, 7.0], [3.0, 8.0, 3.0, 1.0, 2.0, 3.0, 3.0])
(30.0, [2.0, 2.0, 3.0, 11.0, 4.0, 6.0, 6.0, 6.0, 7.0], [4.0, 8.0, 3.0, 1.0, 2.0, 3.0, 4.0])
(32.0, [2.0, 2.0, 3.0, 11.0, 4.0, 6.0, 6.0, 6.0, 7.0], [5.0, 8.0, 3.0, 1.0, 2.0, 3.0, 3.0, 4.0])
(13.0, [3.0, 8.0, 3.0, 1.0, 2.0, 3.0, 3.0], [4.0, 8.0, 3.0, 1.0, 2.0, 3.0, 4.0])
(17.0, [3.0, 8.0, 3.0, 1.0, 2.0, 3.0, 3.0], [5.0, 8.0, 3.0, 1.0, 2.0, 3.0, 3.0, 4.0])
(13.0, [4.0, 8.0, 3.0, 1.0, 2.0, 3.0, 4.0], [5.0, 8.0, 3.0, 1.0, 2.0, 3.0, 3.0, 4.0])
(0.0, [1.0, 2.0, 3.0, 11.0, 11.0, 6.0, 6.0, 6.0, 6.0], [1.0, 2.0, 3.0, 11.0, 11.0, 6.0, 6.0, 6.0, 6.0])
(0.0, [2.0, 2.0, 3.0, 11.0, 4.0, 6.0, 6.0, 6.0, 7.0], [2.0, 2.0, 3.0, 11.0, 4.0, 6.0, 6.0, 6.0, 7.0])
(0.0, [3.0, 8.0, 3.0, 1.0, 2.0, 3.0, 3.0], [3.0, 8.0, 3.0, 1.0, 2.0, 3.0, 3.0])
(0.0, [4.0, 8.0, 3.0, 1.0, 2.0, 3.0, 4.0], [4.0, 8.0, 3.0, 1.0, 2.0, 3.0, 4.0])
(0.0, [5.0, 8.0, 3.0, 1.0, 2.0, 3.0, 3.0, 4.0], [5.0, 8.0, 3.0, 1.0, 2.0, 3.0, 3.0, 4.0])
我们发现,在DBSCAN聚类中,如何调整区分不同类别曲线的距离阀值是关键。
完整代码如下:
# coding=utf-8
import matplotlib.pyplot as plt
import numpy as np
from sklearn.cluster import DBSCAN


class ToolFuncOfDTW:
    def __init__(self):
        pass

    @staticmethod
    def print_matrix(mat):
        print('[matrix] width : %d height : %d' % (len(mat[0]), len(mat)))
        print('-----------------------------------')
        for i in range(len(mat)):
            print(mat[i])  # [v[:2] for v in mat[i]]


class DTW:

    def __init__(self):
        pass

    @staticmethod
    def numpy_num_to_python_num(p1):
        if isinstance(p1, np.int32):
            p1 = int(p1)
        elif isinstance(p1, np.float64):
            p1 = float(p1)
        return p1

    @staticmethod
    def dist_for_float(p1, p2):
        p1 = DTW.numpy_num_to_python_num(p1)
        p2 = DTW.numpy_num_to_python_num(p2)
        if (type(p1) == float or type(p1) == int) and \
                (type(p2) == float or type(p2) == int):
            dist = float(abs(p1 - p2))
            return dist
        else:
            sum_val = 0.0
            for i in range(len(p1)):
                sum_val += pow(p1[i] - p2[i], 2)
            dist = pow(sum_val, 0.5)
            return dist

    @staticmethod
    def dtw(s1, s2, dist_func):
        w = len(s1)
        h = len(s2)

        mat = [([[0, 0, 0, 0*j*i] for j in range(w)]) for i in range(h)]

        for x in range(w):
            for y in range(h):
                dist = dist_func(s1[x], s2[y])
                mat[y][x] = [dist, 0, 0, 0]
                # DTW.print_matrix(mat)

        elem_0_0 = mat[0][0]
        elem_0_0[1] = elem_0_0[0] * 2

        for x in range(1, w):
            mat[0][x][1] = mat[0][x][0] + mat[0][x - 1][1]
            mat[0][x][2] = x - 1
            mat[0][x][3] = 0

        for y in range(1, h):
            mat[y][0][1] = mat[y][0][0] + mat[y - 1][0][1]
            mat[y][0][2] = 0
            mat[y][0][3] = y - 1

        for y in range(1, h):
            for x in range(1, w):
                distlist = [mat[y][x - 1][1], mat[y - 1][x][1], 2 * mat[y - 1][x - 1][1]]
                mindist = min(distlist)
                idx = distlist.index(mindist)
                mat[y][x][1] = mat[y][x][0] + mindist
                if idx == 0:
                    mat[y][x][2] = x - 1
                    mat[y][x][3] = y
                elif idx == 1:
                    mat[y][x][2] = x
                    mat[y][x][3] = y - 1
                else:
                    mat[y][x][2] = x - 1
                    mat[y][x][3] = y - 1

        result = mat[h - 1][w - 1]
        retval = result[1]
        path = [(w - 1, h - 1)]
        while True:
            x = result[2]
            y = result[3]
            path.append((x, y))

            result = mat[y][x]
            if x == 0 and y == 0:
                # DTW.print_matrix(mat)
                break
        return retval, sorted(path)

    @staticmethod
    def distance(s1, s2, signal_num=-9999):
        # type: (np.ndarray, np.ndarray, int) -> float
        tmp_s1 = []
        for i in s1:
            tmp_s1.append(i)
        tmp_s2 = []
        for i in s2:
            tmp_s2.append(i)
        s1_in = DTW.return_center_data(tmp_s1, signal_num)
        s2_in = DTW.return_center_data(tmp_s2, signal_num)
        result = DTW.dtw(s1_in, s2_in, DTW.dist_for_float)[0]
        print(result, s1_in, s2_in)
        return result

    @staticmethod
    def return_center_data(list_data, signal_num=-9999):
        # type: (list, int) -> list
        start = 0
        end = len(list_data)
        for i in range(len(list_data)):
            if list_data[i] != signal_num:
                start = i
                break

        for i in range(len(list_data)-1, 0, -1):
            if list_data[i] != signal_num:
                end = i + 1
                break
        return list_data[start:end]


class TestDTW:

    def __init__(self):
        pass

    @staticmethod
    def display(s1, s2):
        val, path = DTW.dtw(s1, s2, DTW.dist_for_float)

        w = len(s1)
        h = len(s2)

        mat = [[1] * (w + 0*i) for i in range(h)]
        for node in path:
            x, y = node
            mat[y][x] = 0

        mat = np.array(mat)

        plt.subplot(2, 2, 2)
        plt.pcolor(mat, edgecolors='k', linewidths=4)
        # print(c)
        plt.title('Dynamic Time Warping (%f)' % val)

        plt.subplot(2, 2, 1)
        plt.plot(s2, range(len(s2)), 'g')

        plt.subplot(2, 2, 4)
        plt.plot(range(len(s1)), s1, 'r')

        plt.show()

    @staticmethod
    def test_path():
        s1 = [1, 2, 3, 4, 5, 5, 5, 4]
        s2 = [3, 4, 5, 5, 5, 4]
        # s2 = s1
        # s2 = [1, 2, 3, 4, 5, 5]
        # s2 = [2, 3, 4, 5, 5, 5]
        val, path = DTW.dtw(s1, s2, DTW.dist_for_float)
        TestDTW.display(s1, s2)
        print(val, path)

    @staticmethod
    def test_remove_signal():
        s1 = [1, 2, 3, 4, 5, -9999, -9999, -9999, -9999, -9999]
        s2 = [-9999, -9999, -9999, 1, 2, 3, 4, 5, -9999, -9999, -9999, -9999, -9999]
        # print(np.array(s1), type(np.array(s1)))
        result = DTW.distance(np.array(s1), np.array(s2))
        TestDTW.display(s1, s2)
        print(s1)
        print(s2)
        print(result)

    @staticmethod
    def test_cluster_effect():
        from sklearn.neighbors import NearestNeighbors
        LL = 3

        def d(a, b, l):
            # type: (np.ndarray, np.ndarray, int) -> float
            # print(sum(a.tolist()))
            aa = a.tolist()  # 返回的是可迭代对象,不是list
            bb = b.tolist()
            # print(aa, type(aa))
            # print(bb, type(bb))
            result_d = 0.0

            tmp_list_a = []
            for i in aa:
                tmp_list_a.append(i)

            tmp_list_b = []
            for i in bb:
                tmp_list_b.append(i)

            for i in range(len(tmp_list_b)):
                result_d += (tmp_list_a[i] - tmp_list_b[i])*(tmp_list_a[i] - tmp_list_b[i])
            # print(type(a))
            # print(type(b))
            # result_d = bb + aa + float(2 + L)
            # bb += aa
            # result_d = bb
            return result_d + l

        knn = NearestNeighbors(n_neighbors=2,
                               algorithm='auto',
                               metric=lambda a, b: d(a, b, LL)
                               )
        # X = pd.DataFrame({'b': [0, 3, 2], 'c': [1.0, 4.3, 2.2]})
        X = np.array([[-1, -1],
                      [-2, -1],
                      [-3, -2],
                      [1, 1],
                      [2, 1],
                      [3, 2]])
        knn.fit(X)
        # result = knn.predict([0, 3, 1.9])
        distances, indices = knn.kneighbors(X)
        print(distances)
        print(indices)
        print(knn.kneighbors_graph(X).toarray())
        print("---------------------------")
        distances, indices = knn.kneighbors(np.array([[-3, -3]]))
        print(distances)
        print(indices)
        print(knn.kneighbors_graph(X).toarray())

    @staticmethod
    def test_cluster_effect_agg():
        s = [[1, 2, 3, 11, 11, 6, 6, 6, 6, -9999, -9999, -9999, -9999],
             [-9999, -9999, -9999, 2, 2, 3, 11, 4, 6, 6, 6, 7, -9999],
             [3, 8, 3, 1, 2, 3, 3, -9999, -9999, -9999, -9999, -9999, -9999],
             [4, 8, 3, 1, 2, 3, 4, -9999, -9999, -9999, -9999, -9999, -9999],
             [-9999, -9999, 5, 8, 3, 1, 2, 3, 3, 4,  -9999, -9999, -9999]]
        X = np.array(s)
        dbscan = DBSCAN(eps=14,
                        min_samples=2,
                        metric=lambda a, b: DTW.distance(a, b))  # 可以自定义距离函数
        cluster = dbscan.fit_predict(X)
        print(cluster)
        plt.rcParams.update({'figure.autolayout': True})
        for i in range(len(s)):
            size = (len(s)+1)*100 + 10 + (i+1)
            plt.subplot(size)
            plt.plot(DTW.return_center_data(s[i]))  # , title='title'+str(i)
            plt.xticks([0, 1, 2, 3, 4, 5, 6, 7, 8])
            plt.ylabel(str(i+1))
        plt.xlabel('step')
        plt.show()


if __name__ == "__main__":
    TestDTW.test_cluster_effect_agg()


