R语言:多因素Cox回归森林图 (基于forestplot包) 森林图 cox可视化
R语言|12. 森林图-1: 多因素Cox回归模型森林图 (基于forestplot包)
本期开始介绍Cox回归模型可视化。
之前学习过的的临床回归模型可视化方法主要是森林图和列线图 (Nomogram)。
计划是介绍一下单因素、多因素、亚组分析、其他类型森林图绘制;列线图部分介绍下基本的变量筛选方法、绘制过程、验证方法(ROC/DCA/校准图/分组比较等)、网页版列线图。
本期介绍forestplot包绘制多因素Cox回归模型森林图。
此外,本期在提取Cox回归等结果信息用到了之前介绍过的R语言|7. 快速制作多因素Cox回归三线表 和R语言|4. 轻松绘制临床基线表Table 1,需要的小伙伴点击链接阅读。
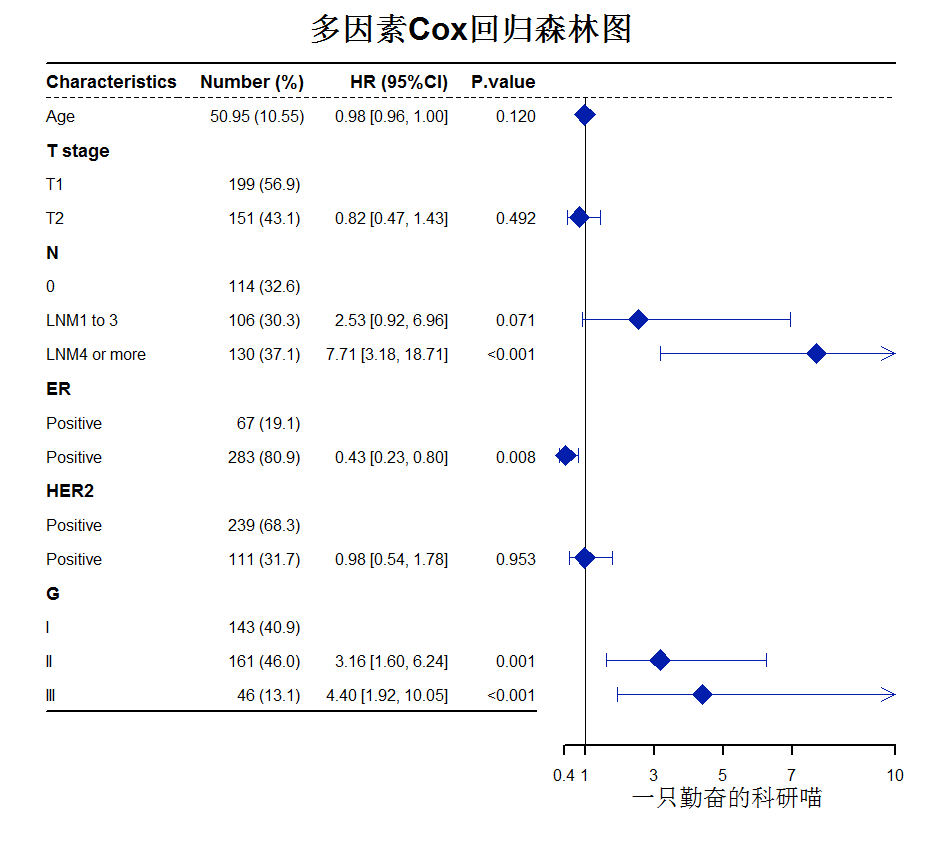
先看效果图
多因素Cox回归森林图
载入R包和数据
#1.载入包
library(tableone)
library(survival)
##画森林图的包
library(forestplot)
library(stringr)
#2.清理工作环境
rm(list = ls())
#3.读入数据
aa<- read.csv('20210209.csv')
#4.查看数据前6行
head(aa)
#5.查看数据数据性质
str(aa)
#6.查看结局,0=复发,1=未复发
aa$status<-factor(aa$status)
summary(aa$status)
一、构建森林图的基本表
#一-1.cox多因素回归分析
mul_cox<-coxph(Surv(time,status==0)~Age+T.stage+LNM+ER+HER2+G,data=aa)
#一-2 multi1:提取:变量+HR+95%CI+95%CI
mul_cox1 <- summary(mul_cox)
colnames(mul_cox1$conf.int)
multi1<-as.data.frame(round(mul_cox1$conf.int[, c(1, 3, 4)], 2))
#一-3、multi2:提取:HR(95%CI)和P
multi2<-ShowRegTable(mul_cox,
                     exp=TRUE,
                     digits=2,
                     pDigits =3,
                     printToggle = TRUE,
                     quote=FALSE,
                     ciFun=confint)
#一-4.将两次提取结果合并成表;取名result
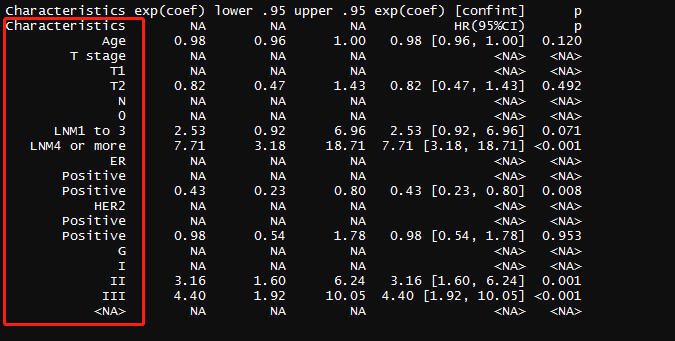
result <-cbind(multi1,multi2);result
#一-5.行名转为表格第一列,并给予命名"Characteristics"
result<-tibble::rownames_to_column(result, var = "Characteristics");result
result表,6列表还缺人群数目列,参考变量,后面慢慢修改
二、森林图的基本图形fig1
fig1<- forestplot(result[,c(1,5,6)], #告诉函数,
合成的表格result的第1,5,6列还是显示数字
   mean=result[,2],   #告诉函数,表格第2列为HR,它要变成森林图的小方块
       lower=result[,3],  #告诉函数表格第3列为95%CI,
     upper=result[,4],  #表格第5列为95%CI,它俩要化作线段,穿过方块
     zero=1,            #告诉函数,零线或参考线为HR=1即x轴的垂直线
       boxsize=0.3,       #设置小黑块的大小
        graph.pos=2)       #森林图应插在图形第2列
基本图形
三、森林图图形修饰
修饰项目
三-1、显示所有变量;
三-2、加入患者数目;
三-3、加水平线、垂直辅助线、x周标签、大标题、森林图占比;
三-4、字体大小增粗、线条粗细、线型(包括置信区间)、行间距、列间距;
三-5、颜色、HR方块形状等。
其中,1.2是对表的修改,改完表,图就改了;3-5步是通过改字体、线宽等优化的。这5项在我们掌握后可按照自己需要随意组合使用。
三-1、显示所有变量
#1.删除部分变量名,只保留亚变量即:"ER_Positive"变为"Positive"
result$Characteristics<-str_remove(result$Characteristics,"T.stage|N|ER|HER2|G")

#2. 给参考变量插入空行
#2-1.这步代码不用改
ins <- function(x) {c(x, rep(NA, ncol(result)-1))}
##2-2:插入空行,形成一个新表
for(i in 5:6) {result[, i] = as.character(result[, i])}
result<-rbind(c("Characteristics", NA, NA, NA, "HR(95%CI)","p"),
               result[1, ],
             ins("T stage")
             ins("T1"),
               result[2, ],
             ins("N"),
             ins("0"),
               result[3:4, ],
             ins("ER"),
             ins("Positive"),
               result[5, ],
             ins("HER2"),
             ins("Positive"),
               result[6, ],
             ins("G"),
             ins("I"),
               result[7:nrow(result), ],
             c(NA, NA, NA, NA, NA,NA)#
             )
for(i in 2:4) {result[, i] = as.numeric(result[, i])}
显示所有变量的表
fig2 <- forestplot(result[,c(1,5,6)],
           mean=result[,2],
           lower=result[,3],
           upper=result[,4],
           zero=1,
           boxsize=0.5,
           graph.pos=2)
显示所有变量名的图fig2
三-2、显示所有亚组的患者数
#1-1
myVars <- c("Age","T.stage","LNM","ER","HER2","G")
#1-2
catVars <-  c("T.stage","LNM","ER","HER2","G")
#1-3
table1<- print(CreateTableOne(vars=myVars,
                              data = aa,
                              factorVars = catVars),
               showAllLevels=TRUE)

#2. 在基线表table1里插入空行,使它的行数和变量跟result一致
N<-rbind(c(NA,NA),
         table1[2, ],
         c(NA, NA),
         table1[3:4,],
         c(NA,NA),
         table1[5:7,],
         c(NA,NA),
         table1[8:9,],
         c(NA,NA),
         table1[10:11,],
         c(NA,NA),
         table1[12:14,],
         c(NA, NA))
N<-N[,-1]
N<-data.frame(N)
#3.把N表和result表合在一起
result1<-cbind(result,N)
#调顺序。变为:变量-N-HR......顺序
result1<-result1[,c(1,7,2:6)]

#4.优化第一行。第一行行名中加入"Number(%)"
for(i in 2:7) {result1[, i] = as.character(result1[, i])}
result1<-rbind(c("Characteristics","Number (%)",NA,NA,NA,"HR (95%CI)","P.value"),
               result1[2:nrow(result1),])
for(i in 3:5) {result1[, i] = as.numeric(result1[, i])}
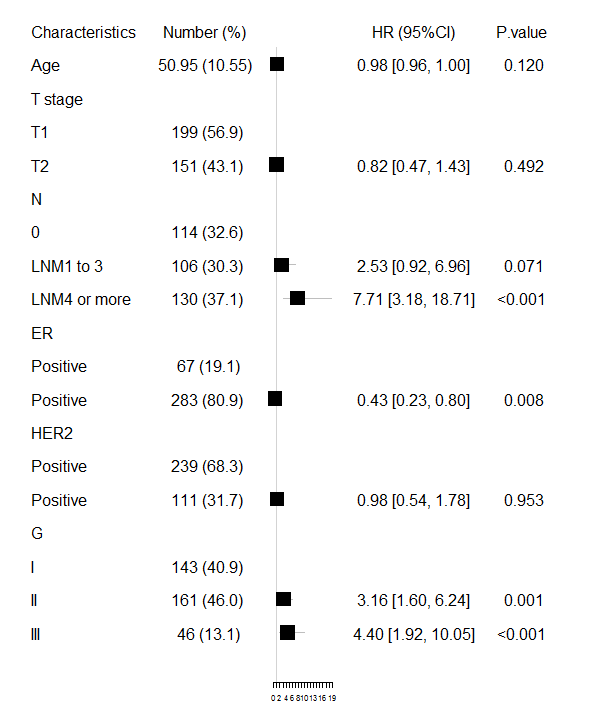
显示人群数目列
#画图fig-3,注:因为多了一列,所以要注意改代码数字
fig3<-forestplot(result1[,c(1,2,6,7)],
           mean=result1[,3],
           lower=result1[,4],
           upper=result1[,5],
           zero=1,
           boxsize=0.4,
           graph.pos=3)
11.png
三-3、图形细节优化
fig3_1<-forestplot(result1[,c(1,2,6,7)],
                 mean=result1[,3],
                 lower=result1[,4],
                 upper=result1[,5],
                 zero=1,
                 boxsize=0.6,
                 graph.pos= "right" ,
                 hrzl_lines=list("1" = gpar(lty=1,lwd=2),
                                 "2" = gpar(lty=2),
                                 "20"= gpar(lwd=2,lty=1,columns=c(1:4)) ),
                 graphwidth = unit(.25,"npc"),
                 xlab="一只勤奋的科研喵",
                 xticks=c(0.4,1,3,5,7,10) ,
                 is.summary=c(T,F,T,F,F,T,F,F,F,T,F,F,T,F,F,T,F,F,F),
                 txt_gp=fpTxtGp(
                  label=gpar(cex=1),
                  ticks=gpar(cex=1),
                  xlab=gpar(cex=1.5),
                  title=gpar(cex=2)),
                 lwd.zero=1,
                 lwd.ci=1.5,
                 lwd.xaxis=2,
                 lty.ci=1.5,
                 ci.vertices =T,
                 ci.vertices.height=0.2,
                 clip=c(0.1,8),
                 ineheight=unit(8, 'mm'),
                 line.margin=unit(8, 'mm'),
                 colgap=unit(6, 'mm'),
                 fn.ci_norm="fpDrawDiamondCI",
                 title="多因素Cox回归森林图",
                  col=fpColors(box ='#021eaa',
                          lines ='#021eaa',
                          zero = "black"))
细节优化
代码的详细解释及其本期数据:R语言|12. 森林图-1: 多因素Cox回归模型森林图 (基于forestplot包)
#多个基因批量cox 多因素回归分析
mySurv=with(phe,Surv(time, event))

cox_results <-apply(exprSet , 1 , function(gene){ #把每个基因 分为高低表达两组 进行多因素回归分析
  group=ifelse(gene>median(gene),'high','low')
  survival_dat <- data.frame(group=group,
                             sex=phe$sex,
                             age=phe$age,stringsAsFactors = F)
  m=coxph(mySurv ~ sex + age + group, #  代码核心句 感兴趣的因素放在最后,这里和deseq2的design正好位置相反
          data =  survival_dat)

  beta <- coef(m)
  se <- sqrt(diag(vcov(m)))
  HR <- exp(beta)  #提取风险因子
  HRse <- HR * se

  #signif(summary(m)$conf.int[,"lower .95"], 5) #lower .95 下限值HR (95% CI for HR)
  #signif(summary(m)$conf.int[,"upper .95"], 5) #lower .95 上限值HR (95% CI for HR)

  #summary(m)
  tmp <- round(cbind(coef = beta, se = se, z = beta/se, p = 1 - pchisq((beta/se)^2, 1),
                     HR = HR, HRse = HRse,
                     HRz = (HR - 1) / HRse, HRp = 1 - pchisq(((HR - 1)/HRse)^2, 1),
                     HRCILL = exp(beta - qnorm(.975, 0, 1) * se),
                     HRCIUL = exp(beta + qnorm(.975, 0, 1) * se),
                     lower_95=signif(summary(m)$conf.int[,"lower .95"], 5),
                     upper_95=signif(summary(m)$conf.int[,"upper .95"], 5)   ), 3)
  return(tmp['grouplow',])

}
)
cox_results=t(cox_results)
head(cox_results)
table(cox_results[,4]<0.05)
cox_results[cox_results[,4]<0.05,]
head(cox_results)
head(cox_results[cox_results[,4]<0.05,])
summary(m)

#save(phe,phe_final_3,exprSet,cox_results,file = "G:/r/duqiang_IPF/GSE70866_metainformation_4_platforms/3_ipf_combined_cox_univariate_Adjuste_for_age_sex.RData")
load("G:/r/duqiang_IPF/GSE70866_metainformation_4_platforms/3_ipf_combined_cox_univariate_Adjuste_for_age_sex.RData")
#单个基因cox 回归分析 (多因素)
#森林图绘制https://www.jianshu.com/p/52232599fc3b
library("survival")
library("survminer")
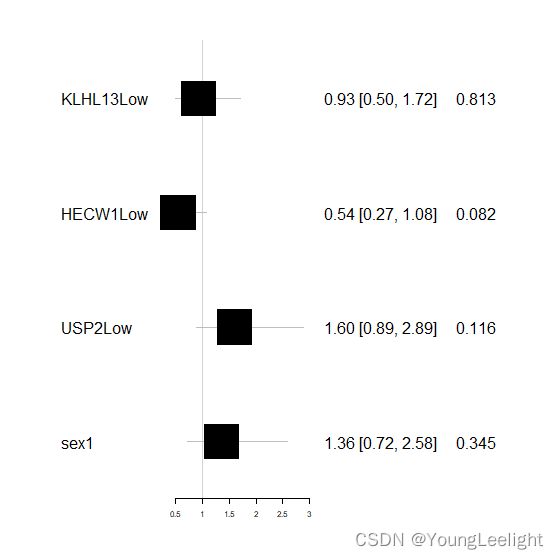
res.cox <- coxph(Surv(time, event) ~ KLHL13+HECW1+USP2+sex, data = phe_final_3)
res.cox
summary(res.cox)
#一-2 multi1:用于提取:变量+HR+95%CI+95%CI,4列
mul_cox1<-summary(res.cox)
colnames(mul_cox1$conf.int)
multi1<-as.data.frame(round(mul_cox1$conf.int[,c(1,3,4)],2))
multi1

#multi2 提取 HR
library(tableone)
multi1<-ShowRegTable(res.cox,
             exp=TRUE,
             digits=2,
             pDigits =3,
             printToggle = TRUE,
             quote=FALSE,
             ciFun=confint)

##2 提取HR.P.95%CI
cox1<-summary(res.cox)
#3 提取回归系数、统计量等
library(broom)
multi2<-tidy(res.cox);multi2
#4 将两次提取结果合并
multi3=cox1$conf.int;multi3
multi<-cbind(multi1,multi2,multi3);multi

result=tibble::rownames_to_column(multi,var = "Characteristics");result
#森林图的基本图形
#BiocManager::install("forestplot")
library(forestplot)
fig1<- forestplot(result[,c(1,2,3)], #告诉函数,合成的表格result的第1,2,3列还是显示数字
                  mean=result[,9],   #告诉函数,表格第9列为HR,它要变成森林图的小方块
                  lower=result[,ncol(results)-1],  #告诉函数表格第3列为5%CI,
                  upper=result[,ncol(results)],  #表格第5列为95%CI,它俩要化作线段,穿过方块
                  zero=1,            #告诉函数,零线或参考线为HR=1即x轴的垂直线
                  boxsize=0.3,       #设置小黑块的大小
                  graph.pos=2)       #森林图应插在图形第2列


