Python 处理dat文件并画图
import numpy as np
import my_class
import matplotlib.pyplot as plt
import cartopy.crs as ccrs
file = r"D:\lunwen\lunwenshuju\各种作业数据\H500.txt"
f = open(file, "r")
data = np.loadtxt(file, dtype=str,delimiter='\n')
lines = f.readlines()
dataset = []
for line in lines:
    data = line.strip("\n")
    data = data.split('\t')
    dataset.append(data)
dataset = np.array(dataset)
a = np.zeros(48)
i = 0
b = 0
while i < 48:
    a[i] = b
    i = i+1
    b = b+18
a = a.astype(int)  # 化为整数
dataset = np.delete(dataset, a, axis=0)
# 删除空格
# 建立一个37*17*48的三维数组
hgt = np.zeros((17, 37, 48))
# 将二维变成三维
for k in range(48):
    for i in range(17):
        c = dataset[i][0]
        c = c.replace(" ", "")
        w = 6
        for j in range(37):
            hgt[i, j, k] = float(c[w-6:w])
            w = w+6
# 对hgt进行处理
# 画出气候场
hgt_qihou = hgt.mean(2)
# 画出距平场
hgt_juping = hgt
for i in range(48):
    hgt_juping[:, :, i] = hgt_juping[:,:,i]-hgt_qihou
hgt_juping = hgt_juping.mean(2)
#  画出均方差场
hgt_junfangcha = hgt
for i in range(48):
    hgt_junfangcha[:,:,i] =hgt_junfangcha[:,:,i]+np.power((hgt_junfangcha[:,:,i] - hgt_qihou), 2)
hgt_junfangcha = hgt_junfangcha.mean(2)
hgt_junfangcha = np.sqrt(hgt_junfangcha)

hgt_max = np.max(hgt_qihou)  # 算出最大值
hgt_min = np.min(hgt_qihou)  # 算出最小值
# print(hgt_qihou.shape)
# print(hgt_min)
# print(hgt_max)

# 画图
lon = np.arange(60, 150+2.5, 2.5)  # 设立经度
lat = np.arange(0, 40+2.5, 2.5)  # 设立纬度
lon, lat = np.meshgrid(lon, lat)
#  画图设置
plt.rcParams.update({'font.size': 13})
#  解决中文乱码问题
plt.rcParams['font.sans-serif'] = ['KaiTi']
#  解决负号乱码问题
plt.rcParams['axes.unicode_minus'] = False
fig = plt.figure(figsize=[8, 8])
ax = fig.add_subplot(111, projection=ccrs.PlateCarree())
# 设置x, y轴标签
ax.set_xticks(np.arange(60, 150+7.5, 7.5), crs=ccrs.PlateCarree())
ax.set_yticks(np.arange(0, 40+2.5, 5), crs=ccrs.PlateCarree())
xtick_str = ['60', ' ',  '75',' ',  '90',' ', '105',' ', '120',' ', '135',' ', '150']
ax.set_xticklabels(xtick_str, fontsize=18)
ytick_str = ['0', ' ', '10', ' ', '20', ' ', '30', ' ', '40']
ax.set_yticklabels(ytick_str, fontsize=18)
my_class.readshapefile(r"D:\lunwen\lunwenshuju\Shp\ocean_shp\Pacific\Export_Output_5.shp", linewidth=1, ax=ax)  # 太平洋
my_class.readshapefile(r"D:\lunwen\lunwenshuju\Shp\ne_10m_admin_0_countries\ne_10m_admin_0_countries.shp", linewidth=1, ax=ax)  #世界地图
my_class.readshapefile(r"D:\lunwen\lunwenshuju\Shp\ocean_shp\Indian\iho.shp", linewidth=1, ax=ax)  # 印度洋
my_class.readshapefile(r"D:\lunwen\lunwenshuju\Shp\china\china.shp", linewidth=1, ax=ax)
levels = np.arange(5310, 5890, 1)
precipRateESurface_conf = ax.contourf(lon, lat, hgt_qihou, cmap='RdBu_r', extend='both', levels=levels)
T_cb = fig.colorbar(precipRateESurface_conf, orientation='vertical', shrink=0.75)
# 标签字体设置
font = {'family': 'Times New Roman',
        'weight': 'normal',
        'size': 20
}
T_cb.set_label("gpm", fontdict=font)
ax.set_title("500hP高度场的气候场")
plt.show()
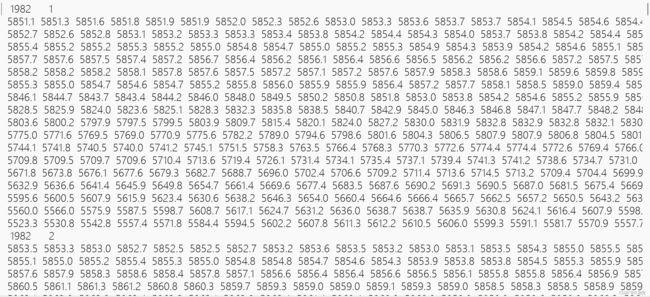
dat数据将后缀改成txt后长这样:
上面没有经纬度,只有对应经纬度的数据,因此先进行数据处理。
思路:首先每行读取数据按照经纬度,数据是由北向南,由西向东的。通过np.delete()删除每行年份和月份。然后将字符转化成数字读取转化成三维数据,最后进行数据处理后绘图就行
