基于Python的网络拓扑图绘制
最近写论文画了许多图,在这里记录一些。当然,如果仅仅是展示性图片的话也可以使用visio,但是这里我仍然想探究一下如何使用pyhon画出美观的网络拓扑图。
一、画出网络拓扑图
给出邻接矩阵,画出网络的拓扑图:
import networkx as nx
import matplotlib.pyplot as plt
import numpy as np

G = nx.Graph()
Matrix = np.array(
    [
        [0, 0, 1, 1, 1, 1],  # a
        [0, 0, 1, 1, 0, 1],  # b
        [1, 1, 0, 0, 1, 1],  # c
        [1,	1, 0, 0, 1, 1],  # d
        [1, 0, 1, 1, 0, 1],  # e
        [1, 1, 1, 1, 1, 0],
    ])

for i in range(len(Matrix)):
    for j in range(len(Matrix)):
        if Matrix[i, j] != 0:
            G.add_edge(i, j)

pos = nx.random_layout(G)
nx.draw(G, node_size=50, node_color='black', edge_color='b', width=2)
plt.show()
效果如下:
也可以根据需求改变节点或链路的形状
pos = nx.random_layout(G)
# nx.draw(G, node_size=50, node_color='black', edge_color='b', width=2)
nx.draw_networkx_nodes(G, pos, node_shape='*', node_size=500, node_color='orange')#1800,100
nx.draw_networkx_edges(G, pos, edge_color='b', width=2, style='dashed')# solid|dashed|dotted, dashdot
plt.show()
效果如下:
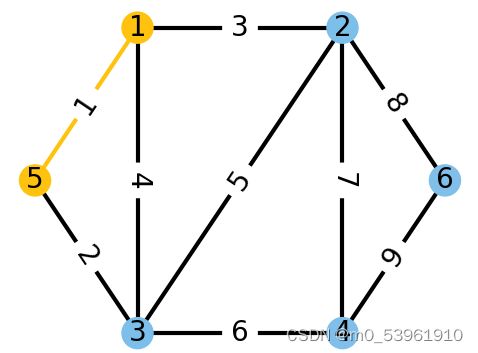
二、画出网络拓扑图,并对节点和链路进行表示
为了在论文中美观的表示出网络拓扑以及节点和链路的序号,也可以使用visio进行画图,但是这样会比较慢,所以试图寻找基于python的画图方法。
import networkx as nx
import matplotlib.pyplot as plt

G = nx.Graph()
# 确定节点之间的链接关系(边),并对边进行编号(或标出边的权重)
G.add_edge(5, 1, weight=1)
G.add_edge(5, 3, weight=2)
G.add_edge(1, 2, weight=3)
G.add_edge(1, 3, weight=4)
G.add_edge(3, 2, weight=5)
G.add_edge(3, 4, weight=6)
G.add_edge(2, 4, weight=7)
G.add_edge(2, 6, weight=8)
G.add_edge(4, 6, weight=9)


data = {(u, v): weight['weight'] for (u, v, weight) in G.edges(data=True)}
# 确定节点在图中的位置(画出来的图比较好看)
pos = {1: [0, 0],
       2: [5, 0],
       3: [0, -5],
       4: [5, -5],
       5: [-2.5, -2.5],
       6: [7.5, -2.5],
       }
# 对节点的颜色进行标注
color_map = ["#ffc20e"]#5
color_map.extend(["#ffc20e"])#1
color_map.extend(["#7bbfea"])#3
color_map.extend(["#7bbfea"])#2
color_map.extend(["#7fbfea"])#4
color_map.extend(["#7fbfea"])#6

# 对链路的颜色进行标注
edge_map = ["#ffc20e"]
edge_map.extend(['black']*8)

nx.draw_networkx_nodes(G, pos, node_size=500, node_color=color_map)#1800,100
nx.draw_networkx_edges(G, pos, width=3, edge_color=edge_map)#1,5
nx.draw_networkx_labels(G, pos, font_size=20)#40
nx.draw_networkx_edge_labels(G, pos, data, font_size=20)#30
plt.show()
效果如图所示:
由于我们要尽可能做到论文中的图在只有黑白色时仍然不影响阅读,因此也可以对其中节点或链路的大小进行随意设置。
size_map = ([1000]*2)
size_map.extend([500]*4)

edge_size = [6]
edge_size.extend([3]*8)

nx.draw_networkx_nodes(G, pos, node_size=size_map, node_color=color_map)#1800,100
nx.draw_networkx_edges(G, pos, width=edge_size, edge_color=edge_map)#1,5
nx.draw_networkx_labels(G, pos, font_size=20)#40
nx.draw_networkx_edge_labels(G, pos, data, font_size=20)#30
plt.show()
最终效果展示如下:


