机器学习——决策树,DecisionTreeClassifier参数详解,决策树可视化查看树结构
决策树
决策树是一种树型结构,其中每个内部节结点表示在一个属性上的测试,每一个分支代表一个测试输出,每个叶结点代表一种类别。
在书面的代码中,为了可视化的方便,我们采用特征组合的方式,将鸢尾花的四个两两进行组合,分别建立决策树模型,并对其进行验证。
DecisionTreeClassifier(criterion='entropy', min_samples_leaf=3)函数为创建一个决策树模型,其函数的参数含义如下所示:
- criterion:gini或者entropy,前者是基尼系数,后者是信息熵。
- splitter: best or random 前者是在所有特征中找最好的切分点 后者是在部分特征中,默认的”best”适合样本量不大的时候,而如果样本数据量非常大,此时决策树构建推荐”random” 。
- max_features:None(所有),log2,sqrt,N 特征小于50的时候一般使用所有的
- max_depth: int or None, optional (default=None) 设置决策随机森林中的决策树的最大深度,深度越大,越容易过拟合,推荐树的深度为:5-20之间。
- min_samples_split:设置结点的最小样本数量,当样本数量可能小于此值时,结点将不会在划分。
- min_samples_leaf: 这个值限制了叶子节点最少的样本数,如果某叶子节点数目小于样本数,则会和兄弟节点一起被剪枝。
- min_weight_fraction_leaf: 这个值限制了叶子节点所有样本权重和的最小值,如果小于这个值,则会和兄弟节点一起被剪枝默认是0,就是不考虑权重问题。
- max_leaf_nodes: 通过限制最大叶子节点数,可以防止过拟合,默认是"None”,即不限制最大的叶子节点数。
- class_weight: 指定样本各类别的的权重,主要是为了防止训练集某些类别的样本过多导致训练的决策树过于偏向这些类别。这里可以自己指定各个样本的权重,如果使用“balanced”,则算法会自己计算权重,样本量少的类别所对应的样本权重会高。
- min_impurity_split: 这个值限制了决策树的增长,如果某节点的不纯度(基尼系数,信息增益,均方差,绝对差)小于这个阈值则该节点不再生成子节点。即为叶子节点 。
plt.suptitle(u'决策树对鸢尾花数据的两特征组合的分类结果', fontsize=18)设置整个大画布的标题
plt.tight_layout(2) 调整图片的布局
plt.subplots_adjust(top=0.92) 自适应,绘图距顶部的距离为0.92。
 1 import numpy as np
 2 import matplotlib.pyplot as plt
 3 import matplotlib as mpl
 4 from sklearn.tree import DecisionTreeClassifier
 5
 6
 7 def iris_type(s):
 8     it = {b'Iris-setosa': 0, b'Iris-versicolor': 1, b'Iris-virginica': 2}
 9     return it[s]
10
11 iris_feature = u'花萼长度', u'花萼宽度', u'花瓣长度', u'花瓣宽度'
12
13 if __name__ == "__main__":
14     mpl.rcParams['font.sans-serif'] = [u'SimHei']
15     mpl.rcParams['axes.unicode_minus'] = False
16
17     path = '../dataSet/iris.data'  # 数据文件路径
18     data = np.loadtxt(path, dtype=float, delimiter=',', converters={4: iris_type})
19     x_prime, y = np.split(data, (4,), axis=1)
20
21     feature_pairs = [[0, 1], [0, 2], [0, 3], [1, 2], [1, 3], [2, 3]]
22     plt.figure(figsize=(10, 9), facecolor='#FFFFFF')
23     for i, pair in enumerate(feature_pairs):
24         # 准备数据
25         x = x_prime[:, pair]
26
27         # 决策树学习
28         clf = DecisionTreeClassifier(criterion='entropy', min_samples_leaf=3)
29         dt_clf = clf.fit(x, y)
30
31         # 画图
32         N, M = 500, 500
33         x1_min, x1_max = x[:, 0].min(), x[:, 0].max()
34         x2_min, x2_max = x[:, 1].min(), x[:, 1].max()
35         t1 = np.linspace(x1_min, x1_max, N)
36         t2 = np.linspace(x2_min, x2_max, M)
37         x1, x2 = np.meshgrid(t1, t2)
38         x_test = np.stack((x1.flat, x2.flat), axis=1)
39
40
41         y_hat = dt_clf.predict(x)
42         y = y.reshape(-1)
43         c = np.count_nonzero(y_hat == y)    # 统计预测正确的个数
44         print('特征:  ', iris_feature[pair[0]], ' + ', iris_feature[pair[1]])
45         print('\t预测正确数目:', c)
46         print('\t准确率: %.2f%%' % (100 * float(c) / float(len(y))))
47
48         # 显示
49         cm_light = mpl.colors.ListedColormap(['#A0FFA0', '#FFA0A0', '#A0A0FF'])
50         cm_dark = mpl.colors.ListedColormap(['g', 'r', 'b'])
51         y_hat = dt_clf.predict(x_test)  # 预测值
52         y_hat = y_hat.reshape(x1.shape)
53         plt.subplot(2, 3, i+1)
54         plt.pcolormesh(x1, x2, y_hat, cmap=cm_light)
55         plt.scatter(x[:, 0], x[:, 1], c=y, edgecolors='k', cmap=cm_dark)
56         plt.xlabel(iris_feature[pair[0]], fontsize=14)
57         plt.ylabel(iris_feature[pair[1]], fontsize=14)
58         plt.xlim(x1_min, x1_max)
59         plt.ylim(x2_min, x2_max)
60         plt.grid()
61     plt.suptitle(u'决策树对鸢尾花数据的两特征组合的分类结果', fontsize=18)
62     plt.tight_layout(2)
63     plt.subplots_adjust(top=0.92)
64     plt.show()
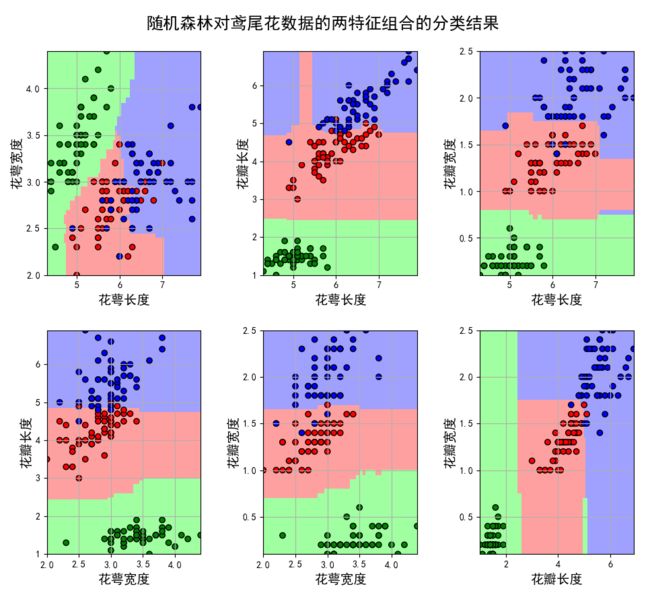
结果如下:
不同的特征组合的决策树模型的准确率:
决策树的保存
当我们通过建立好决策树之后,我们应该怎样查看建立好的决策树呢?sklearn已经帮助我们写好了方法,代码如下:
1 from sklearn import tree  #需要导入的包
2
3 f = open('../dataSet/iris_tree.dot', 'w')
4 tree.export_graphviz(model.get_params('DTC')['DTC'], out_file=f)
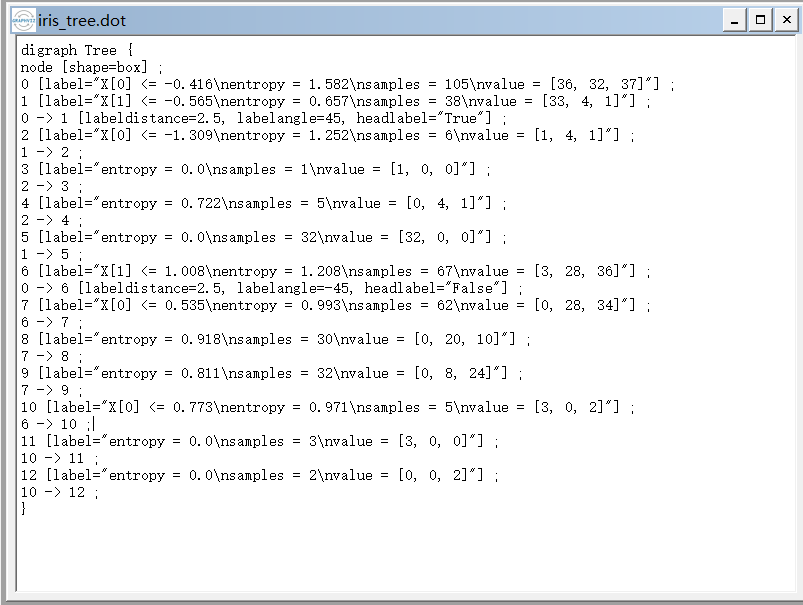
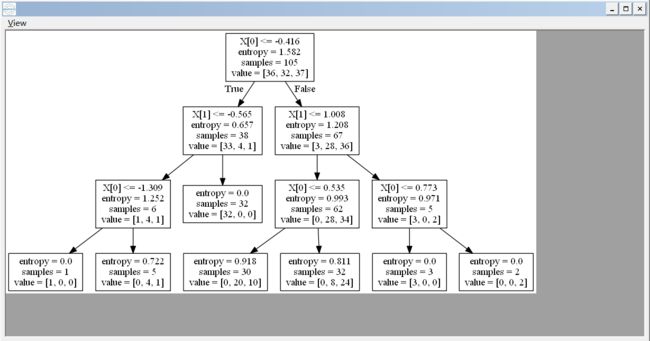
当我们运行之后,程序会生成一个.dot的文件,我们能够通过word打开这个文件,你看到的是树节点的一些信息,我们通过graphviz工具能够查看树的结构:


