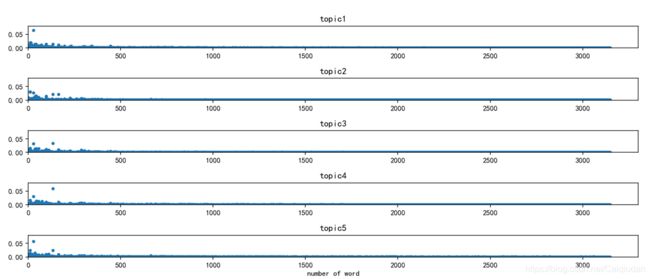
matplotlib画子图、调整子图间距、设置子图、大图标题 画箱线图; 子图标题位置
plt.tight_layout() 自动调整子图间距
调整前:

调整后
fig = plt.figure(figsize=(12,5))
for i in range(5):
    ax = fig.add_subplot(5, 1, i+1)                      # 3行3列的第一个位置
    word_pro = lda.get_topic_terms(i, topn=10000)
    word_pro_x = list(map(lambda x: x[0],word_pro))
    word_pro_y = list(map(lambda x: x[1],word_pro))
    ax.scatter(word_pro_x, word_pro_y,s=10)
    plt.ylim([0,0.08]); plt.xlim(0,3300)
    ax.set_title(f'topic{i+1}')                          # 设置小图标题
plt.tight_layout()                                       # 自动调整子图间距
plt.xlabel('number of word')                             # 不设置总标题
fig.suptitle(None)                                       # 设置大图标题

设置子图标题: ax.set_title() 设置总图标题:fig.suptitle
fig.add_subplot(1, 3, 1).set_ylabel(r'$Score_{nlp}$') 指定某个子图来设置总x轴标签标题
# 不同星级的情感评分
fig = plt.figure(dpi=150)  # dpi=150
for n, df in enumerate([df_m,df_p,df_h]):
    ax = fig.add_subplot(1, 3, n+1)                      # 3行3列的第一个位置
    df.boxplot(column='final_score',by=['star_rating'],ax=ax)
    ax.set_title(f'{df.index.name}')                          # 不设置子标题
    ax.set_xlabel(None)
    ax.set_xlabel(' Star rating ')
fig.add_subplot(1, 3, 1).set_ylabel(r'$Score_{nlp}$')    # 单独设置某个
plt.tight_layout()                                       # 自动调整子图间距
fig.suptitle(None)                                            # 不设置总标题
箱线图2
# 不同性别在不同年代上的箱线图
fig = plt.figure(figsize=(8, 4))  # dpi=150
# 绘制不同性别在不同年代上的箱线图
for i, sex in enumerate(['male', 'female']):
    a = 用户标签[['年代', '平均每单购买金额']][用户标签.性别==sex]
    a['对数化平均每单购买金额'] = np.log(a.平均每单购买金额)

    sharey = ax1 if i>0 else None   # 纵轴对齐
    globals()['ax%s'%(i+1)] = plt.subplot(int('12%s'%(i+1)), sharey=sharey)   # ax1、 ax2
    a.boxplot(column='对数化平均每单购买金额', by='年代', ax=globals()['ax%s'%(i+1)])
    plt.xticks(rotation=60)
ax1.set_title('男性', fontsize=13); ax2.set_title('女性', fontsize=13)
fig.suptitle(None)
ax1.set_ylabel('对数化平均每单购买金额')
plt.savefig('不同性别和年代的客户平均每单购买金额的交叉分析箱型图.png', format='png', bbox_inches='tight',
            dpi=300, transparent=True)
画子图的方法2
df.plot 更多参数参考:pandas.DataFrame.plot( )参数详解–CSDN
data.plot(kind='kde', subplots=True, sharex=True) # 'kde'画密度图, subplots:是否画子图, sharex:是否共享x轴
设置子图的标题的位置
ax1.set_title('bala', loc='left')


