plt绘图之自适应子图间距
plt绘图之自适应子图间距
一、plt.subplots(constrained_layout=True)
import matplotlib.pyplot as plt
import matplotlib.colors as mcolors
import matplotlib.gridspec as gridspec
import numpy as np

plt.rcParams['savefig.facecolor']='0.8'
plt.rcParams['figure.figsize']=5,5.

def example_plot(ax,fontsize=12,nodec=False):
    ax.plot([1,2])

    ax.locator_params(nbins=3)
    if not nodec:
        ax.set_xlabel('x-label',fontsize=fontsize)
        ax.set_ylabel('y-label',fontsize=fontsize)
        ax.set_title('Title',fontsize=fontsize)

    else:
        ax.set_xticklabels('')
        ax.set_yticklabels('')

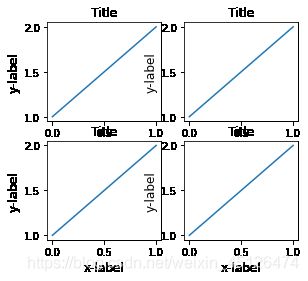
fig,axs=plt.subplots(2,2,constrained_layout=False)
#当有多个子图时,不同坐标系的标签相互重叠了
for ax in axs.flat:
    example_plot(ax)
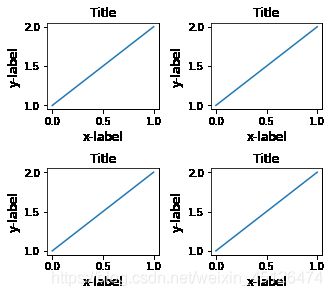
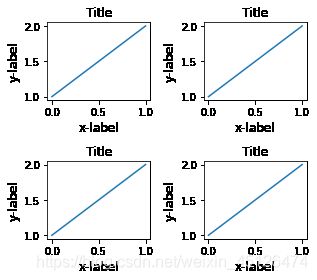
fig,axs=plt.subplots(2,2,constrained_layout=True)#改成True后可以自动调整绘图区域在整个figure上的位置
for ax in axs.flat:
    example_plot(ax)
plt.subplots(constrained_layout=True)的作用是:
自适应子图在整个figure上的位置以及调整相邻子图间的间距,使其无重叠。
二、plt.tight_layout()
另一个和constrained_layout相似的用法是plt.tight_layout()
matplotlib.pyplot.tight_layout(*, pad=1.08, h_pad=None, w_pad=None,
rect=None)
pad,h_pad,w_pad分别调整子图和figure边缘,以及子图间的相距高度、宽度。
plt.close('all')
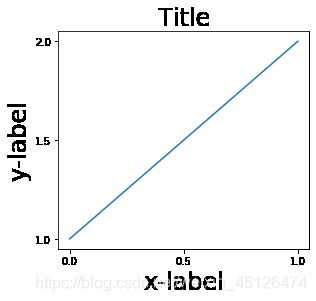
fig1,ax1=plt.subplots()
example_plot(ax1,fontsize=24)#可以看到x轴标签有部分没有显示出来
plt.close('all')
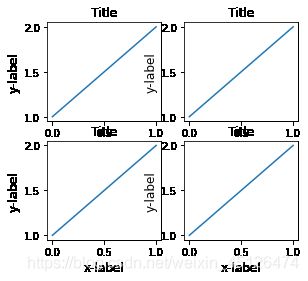
fig,((ax1,ax2),(ax3,ax4))=plt.subplots(2,2)
example_plot(ax1)
example_plot(ax2)
example_plot(ax3)
example_plot(ax4)
fig,((ax1,ax2),(ax3,ax4))=plt.subplots(2,2)
example_plot(ax1)
example_plot(ax2)
example_plot(ax3)
example_plot(ax4)
plt.tight_layout()
fig,((ax1,ax2),(ax3,ax4))=plt.subplots(2,2)
example_plot(ax1)
example_plot(ax2)
example_plot(ax3)
example_plot(ax4)
plt.tight_layout(pad=0.4,h_pad=5.0,w_pad=5.0)
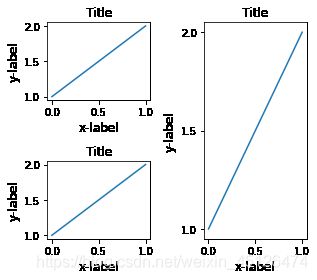
当子图的大小不一样,只要网格规范是兼容的,plt.tight_layout()也起作用。
plt.close('all')
fig=plt.figure()

ax1=plt.subplot(221)
ax2=plt.subplot(223)
ax3=plt.subplot(122)

example_plot(ax1)
example_plot(ax2)
example_plot(ax3)
plt.tight_layout()
由plt.subplot2grid创建的子图,plt.tight_layout()也适用。
plt.close('all')
fig=plt.figure()

ax1=plt.subplot2grid((3,3),(0,0))
ax2=plt.subplot2grid((3,3),(0,1),colspan=2)
ax3=plt.subplot2grid((3,3),(1,0),colspan=2,rowspan=2)
ax4=plt.subplot2grid((3,3),(1,2),rowspan=2)

example_plot(ax1)
example_plot(ax2)
example_plot(ax3)
example_plot(ax4)
plt.tight_layout()

constrained_layout设计比plt.tight_layout更灵活,但是不适合和add_subplot,subplot2grid一起使用。
